This week at a glance
This was the week the AI-operations beat stopped arguing about architecture and started publishing numbers, and almost every one of them points at the same thing: capacity and context you pay for but never use. AWS took a GPU inference cold start apart and found not one bottleneck but six sequential phases totalling eight minutes — driver init, image pull, weight loading, compile — and got the warm-node path under 30 seconds, with the dominant phase depending on model size (a 64 GB model spends 53 seconds in torch.compile; a 203 GB one spends 423 seconds just loading weights). Google Cloud benchmarked the same question from the serving side and found Gemma 3 27B hits a wall past 64 concurrent users on decode-heavy generation, plateauing at a 4.12x throughput multiplier where the 12B model reaches 8.19x — which makes “use the bigger model” an expensive default rather than a safe one. NVIDIA supplied the memory arithmetic underneath both (FP8 quantisation cuts Llama-3.1-8B weights 43.5%, from 16.06 GB to 9.08 GB, with no retraining) and, on Jetson, showed distilled 2026 models delivering reasoning at the edge with 3.37x to 6.28x decode speedups. The money strand converged on the same diagnosis from the software side: Elastic’s audit of 30 production engineering teams attributed 62% of the inference bill to context and lack of guidance rather than model price, at a moment when token prices have fallen 75% and agentic workflows consume 5–30x more tokens per task; Datadog published its own ledger, saving more than $1 million a month mostly by routing internal coding work from Opus to Sonnet ($687,000/month for a measured 8% proficiency loss) and dialling effort levels down; and a systems guide to token optimisation showed prompt caching cutting input cost roughly 70–76% on two worked reference systems. Meanwhile Broadcom made the structural bet that all of this runs on-premises, launching VMware Private AI Cloud and AI Factory on Cloud Foundation 9 against repatriation figures showing public-cloud share for these workloads down 15% year over year to 41%; DoorDash showed what the agent-native platform actually looks like at scale with 130,000 engineering tasks in a month on Firecracker microVMs behind an MCP gateway; AWS documented lifecycle policies that stop agent memory becoming a standing bill; and the observability side did the unglamorous groundwork — span anatomy, sampling strategy, and instrumentation quality you can actually score — while Dynatrace’s State of SRE research reported that 67% of SREs now monitor AI models. The through-line for a platform team is blunt: the wins this week came from measuring one layer more precisely, not from buying one layer more.
On our watch list
- Whether repatriation figures hold up outside vendor decks. Broadcom cites 56% running or planning production inference in private cloud and public-cloud share for these workloads down 15% year over year to 41%. Watch for independent measurement, and watch whether the driver stays cost or shifts decisively to data control.
- Agent identity becoming an infrastructure product. VMware’s AgentMinder bundles agent identity, runtime policy and observability into the virtualization layer. Watch whether the control plane for non-human principals settles with the infrastructure vendors, the identity vendors, or the agent frameworks — whoever wins it inherits the audit trail.
- The gap between planning LLM observability and having it. Elastic’s figures have 85% of enterprise IT organisations planning it and 8% finished. With cost varying up to 30x between identical runs of the same task, that gap is where the unexplained portion of every AI budget currently lives.
- Whether published internal AI ledgers become normal. Datadog put real dollar figures and a measured proficiency trade on the record. Watch whether other engineering organisations follow, because a few more public numbers would do more for AI cost discipline than any amount of vendor benchmarking.
- Autonomous remediation moving from claim to evidence. DataAgent launched the day its funding was announced, and its cost-reduction figure is its own. Watch for a customer-verified deployment fixing production faults unattended, and for what the rollback story looks like when the fix is wrong.
- The CPU side of the latency budget. Akamai’s figure that CPU-side processing can account for up to 90.6% of agentic latency is the most actionable claim on the list and the least instrumented. Watch whether orchestration frameworks start emitting the spans needed to confirm or refute it on real workloads.
- Golden paths rewritten for machine consumers. Gartner naming “agent experience” as a persona and a reported ~40% cost reduction from field-selection tooling both point the same way. Watch whether internal developer platforms start publishing machine-readable contracts — schemas, tool descriptions, permitted action sets — alongside their human documentation.
- Per-tenant persistence economics at agent scale. If agents provision backing services as readily as they provision compute, idle database capacity becomes a standing bill nobody approved. Watch whether sub-second provisioning and scale-to-zero become table stakes, or whether teams retreat to shared multi-tenant schemas and inherit the isolation problems that come with them.
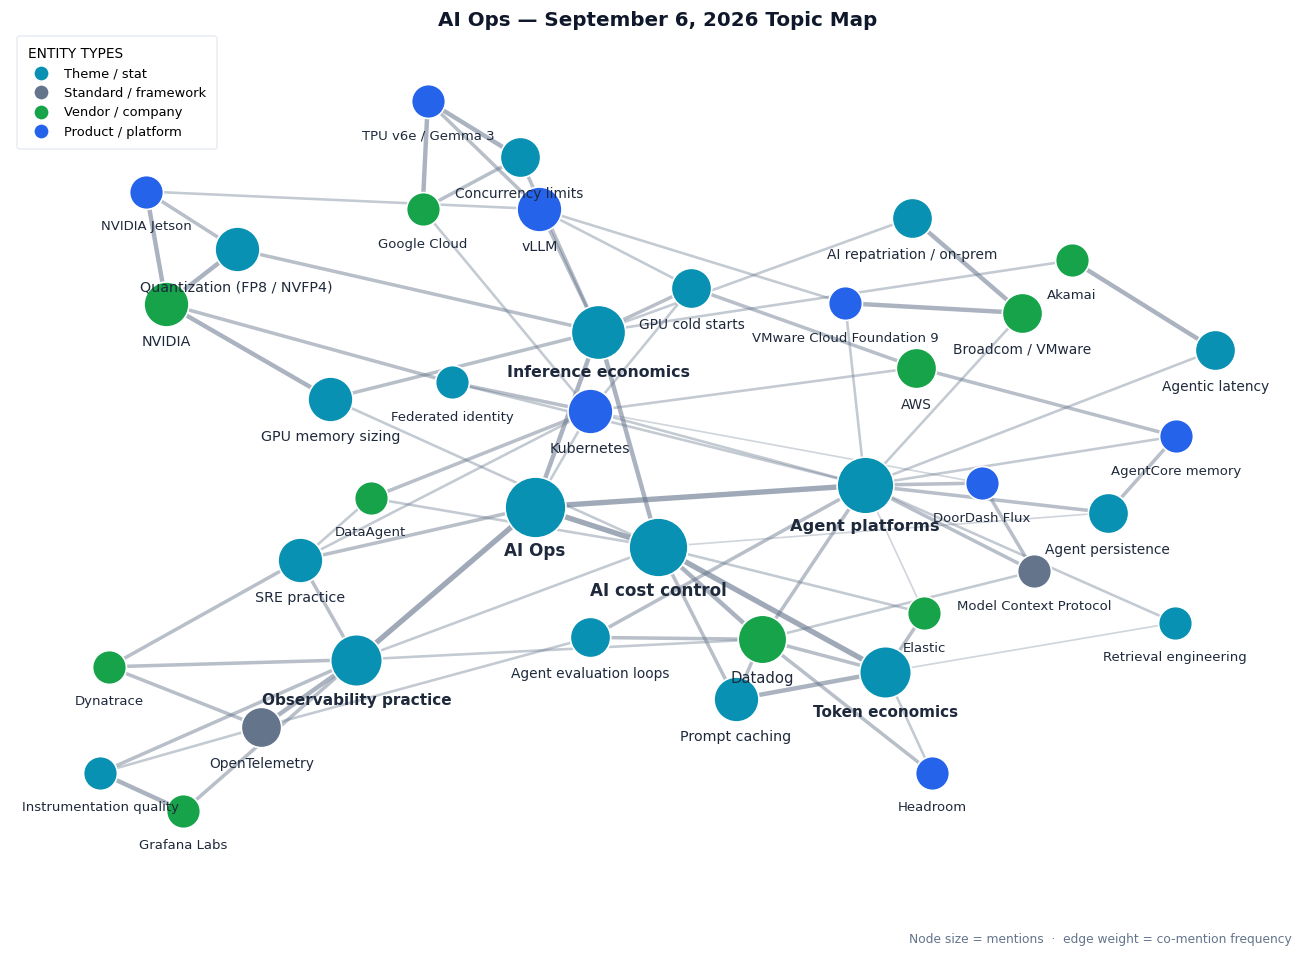
This week’s topic map — inference economics anchors the left-hand cluster, wiring GPU cold starts, memory sizing, quantisation and concurrency limits to vLLM, NVIDIA, Jetson and TPU v6e. AI cost control sits centre, joining token economics, prompt caching, Datadog and Elastic. Agent platforms run to the right through DoorDash Flux, the Model Context Protocol, agent persistence, AgentCore memory and evaluation loops; observability practice anchors the lower-left through OpenTelemetry, instrumentation quality, Grafana and Dynatrace; and Kubernetes ties federated identity, DataAgent and the on-prem VMware stack back into the spine.
View interactive topic map →
Article index
25 articles, grouped by sub-theme. Twenty are from this week’s coverage window (August 31–September 6); five are longer-form foundational reads on the beat.
Inference economics: sizing GPUs, TPUs and the on-prem shift
Where the accelerator money actually goes — a cold start taken apart phase by phase, the memory arithmetic behind GPU selection, reasoning models compressed onto edge hardware, a concurrency wall found by benchmark, and Broadcom’s bet that the whole stack comes back on-premises.
Token economics and LLM cost control
The software half of the same bill: what a production system actually spends per session, how caching changes the arithmetic, and two organisations publishing real dollar figures instead of percentages.
Observability practice and telemetry quality
The groundwork underneath every AI cost number in this issue: what a span is made of, how to decide what to keep, how to score the instrumentation you already have, and what SREs report they are now spending their time on.
Agent platforms and agent-native platform engineering
What it takes to run agents as first-class platform users: sandboxes and playbooks at DoorDash scale, workflows built from chat, the trace-to-experiment loop, memory that expires on purpose, persistence economics, retrieval, and golden paths for a user who is not human.
| Article |
Source |
Published |
| 16. DoorDash’s Flux Runs 130,000 Engineering Tasks through Cloud-Based Agents |
InfoQ |
Aug 31, 2026 |
| 17. Build and run Datadog workflows from Bits Chat or AI agents |
Datadog |
Sep 3, 2026 |
| 18. From traces to experiments: A loop for improving AI agents |
Datadog |
Sep 1, 2026 |
| 19. Designing lifecycle policies for AgentCore memory |
AWS Machine Learning Blog |
Sep 4, 2026 |
| 20. When agents build, deploy, and maintain, persistence becomes the hard problem |
The New Stack |
Sep 1, 2026 |
| 21. Want to scale AI agents without breaking anything? Retrieval engineering is the answer. |
The New Stack |
Sep 3, 2026 |
| 22. Golden Paths for AI agents: What changes when platform users aren’t human? (foundational) |
Datadog |
Aug 25, 2026 |
Agents in production operations: identity, autonomous remediation, latency
Agents inside the blast radius — carrying a user’s identity across federated clusters, a funded attempt at autonomous fault repair in Kubernetes, and the argument that agentic latency is a wait-state problem more compute cannot fix.
Detailed write-ups
1. Eight minutes, six phases: where a GPU cold start actually goes
The New Stack · NVIDIA Developer Blog · September 1–4, 2026
The most useful engineering post of the week is also the most quotable. Sajjan Gundapuneedi, senior manager of software development at AWS, measured a GPU inference cold start end to end and reported: “Eight minutes. Six sequential phases. We expected one bottleneck. We found six, and which one dominates depends on model size.” The optimised path reaches under 30 seconds on a warm node — an 80–93% reduction — and about five minutes on a genuinely cold node, down from eight to fifteen. All of it was measured on p5.48xlarge instances on Amazon EKS Auto Mode, which matters, because two of the six phases are properties of that environment rather than of your code: node provisioning runs 60–90 seconds, and GPU driver initialisation takes two to three minutes on a standard setup versus seconds on EKS Auto Mode. Container image pull is the next two to four minutes on a standard path and 30–60 seconds with SOCI parallel pull.
The model-size dependency is the part to carry into your own capacity plan. For a 64 GB model (Qwen3.6-35B-A3B) weight loading took 29 seconds and torch.compile took 53; for a 203 GB model (Llama-4-Scout at tensor parallel TP=4) weight loading took 423 seconds and compile only 34. Optimise the wrong phase and you will move a number that was never on your critical path. Loading weights from S3 with a parallel streamer took the 64 GB case from 29 seconds to 12 and the 203 GB case from 423 seconds to 25; a warm torch.compile cache brings compilation down to 16–32 seconds on subsequent pods. The economics behind the urgency are stated plainly — a p5.48xlarge is $55 an hour on demand and G-family instances run $10–20 — so every minute a pod spends initialising is billed at full accelerator rate for zero served tokens.
NVIDIA’s companion piece, by Prerana Gambhir and Manasa Manohara, supplies the memory arithmetic that decides which instance you were going to cold-start in the first place. Despite the title it is a sizing and model-optimisation guide rather than a costed TCO model, and it is stronger for it. The headline result: FP8 quantisation of Llama-3.1-8B cuts weight memory from 16.06 GB to 9.08 GB — 43.5% — with no retraining. Sizing then follows workload shape rather than model name, and the token-shape table is the part worth pinning up: chatbots and copilots run 2,000–8,000 input and 200–800 output tokens; agents carry more than 128,000 cached input tokens but emit only 500–1,000 input and 200–300 output; content generation inverts that with 1,000–4,000 output tokens. The heuristics that fall out are concrete: a 24 GB GPU for a 7–8B model and 48 GB for a 13B in a financial-services copilot at 10–50 concurrent sessions with a sub-one-second time-to-first-token target; more than 80 GB per unit for a life-sciences agent handling 20,000 input tokens at 20–30 concurrent users under two seconds; 16–24 GB per GPU for media generation at 50–100-plus users; 8–16 GB entry-level parts for translation at hundreds of concurrent requests. On pruning, Qwen3-8B reduced to roughly 6B parameters, and width pruning beat depth pruning on validation loss — 3.21 versus 3.60. The toolchain is pinned: NeMo container nvcr.io/nvidia/nemo:25.11 with nvidia-modelopt==0.37.0, alongside Model Optimizer and TensorRT, against H100, A100 80GB and Blackwell parts.
The third piece takes the same compression logic to the edge, and its title oversells slightly in a way worth naming: the reasoning arrives on Jetson because the models got smaller, not because frontier-scale inference now fits on a dev kit. Nemotron 3.5 Lightning — 30B total parameters with 3B activated — running with DSpark delivered a 3.37x decode speedup at 123.01–138.02 tokens per second, and Qwen3.8-27B with DFlash2 delivered 6.28x at 27.69–34.44 tokens per second; NVFP4 quantisation on its own accounts for 2.2x–2.33x. The hardware spans Jetson AGX Thor, AGX Orin and Orin Nano, with vLLM v0.28.0 and llama.cpp as the runtimes, and NVIDIA’s own caveat is the one to respect: the speedups varied by workload. Read the three together and the week’s inference lesson is singular — the cheapest capacity is the capacity you stopped provisioning, and every result above came from measuring one layer more precisely rather than buying a larger one.
Sources: The New Stack (cut GPU inference cold start from 8 minutes to less than a minute) · NVIDIA (how to size GPUs for AI inference) · NVIDIA (reasoning models on Jetson)
2. The concurrency wall: a TPU benchmark that changes an autoscaling policy
Google Cloud Blog · The New Stack · August 18 – September 4, 2026
Rupjit Chakraborty of Google Cloud ran the benchmark most teams assume someone else already ran, and the result contradicts a common default. On TPU v6e in a 2×2 single-host chip topology on GKE Autopilot, serving Gemma 3 12B and 27B through vLLM via the vllm-project/tpu-inference stack, he separated two workload shapes that platform teams routinely treat as one: classification, roughly 4,000 input tokens to about 10 output tokens, and generation, 500 input tokens to about 1,000 output. Normalised to 1.00x at 16 concurrent users, generation on the 12B model scales 1.98x at 32 users, 2.96x at 64 and 8.19x at 128. The 27B model does not: “For decode-heavy generation tasks, the Gemma 3 27B model hits a strict performance wall past 64 concurrent users, plateauing at a 4.12x normalized throughput multiplier at 128 users.”
On prefill-heavy classification the two sizes behave far more alike — 6.37x for the 12B model at 128 users against 6.04x for the 27B — which is the finding with operational teeth. The penalty for over-sizing your model is small when the workload is dominated by reading input and large when it is dominated by producing output, so a single model choice applied across a mixed workload is systematically wrong in one direction. The serving configuration is published (max-model-len=128000, max-num-batched-tokens=8192, max-num-seqs=512), and four recommendations fall out of it: downsize to the 12B model for high-concurrency generation; cap concurrent requests at 64 per replica in pod autoscaling; autoscale on end-to-end latency rather than CPU or memory utilisation; and tune VLLM_TPU_BUCKET_PADDING_GAP. If your HPA is currently watching accelerator utilisation, that third point is a config change worth making this week — utilisation stays high while the thing your users feel has already collapsed.
The foundational read alongside it explains why the ceiling arrives sooner than a throughput chart suggests. Akamai’s survey of 200 AI practitioners found 82% of organisations require end-to-end responses under 500 ms for critical use cases and 64% need under 250 ms for their most important one — while half of enterprise AI deployments miss their latency targets at peak load. The number that reframes the problem is where the time goes: CPU-side processing accounts for up to 90.6% of total latency in agentic workloads. Jon Alexander, SVP of product for Akamai’s cloud technology group, states the consequence directly — “More GPU capacity does nothing for this. You can’t brute-force your way out of a wait state.” With LangChain’s 2026 survey of more than 1,300 professionals reporting 57.3% of organisations now running agents in production, up from 51% the prior year, the population exposed to that wait state is growing faster than the hardware answer to it. Put the two pieces together and the practical instruction is the same one: instrument the orchestration path, not just the accelerator, then set your concurrency ceiling from a latency measurement rather than a utilisation graph.
Sources: Google Cloud (benchmarking TPU performance on classification vs. generation) · The New Stack (agentic AI has a latency problem that more compute won’t solve)
3. The token bill: caching, cascading, and two organisations showing their books
The New Stack · Datadog · Elastic · August 26 – September 4, 2026
The systems guide to production token optimisation, by Boris Chabeda, is the reference read behind every cost story in this issue, and its framing is the correct one: “Token optimization is not accounting; it’s a distributed systems challenge.” It works from a stated baseline — about $3 per million input tokens and $15 per million output for a mid-tier frontier model, so output runs four to five times the price of input — and two worked reference systems rather than adjectives. “Concierge”, a 10-turn customer-support chat, burns 45,300 tokens per session; “Pathfinder”, a 15-step CI-debugging agent, burns 150,000 tokens per session and 570,000 in a 30-step worst case. The interventions are measured against those. Rewriting Concierge’s system prompt took it from 3,100 to 380 tokens, a 60% overall reduction; compressing incoming tool observations cut Pathfinder’s inbound volume 3x; schema enforcement dropped malformed model outputs below 0.5%. Prompt caching, priced at a 90% discount on cache reads, cut input cost roughly 70% over ten turns on Concierge and 76% on Pathfinder. Semantic caching found 34% of Concierge tickets were duplicates and served them in sub-50 ms. Model cascading moved 70% of Concierge chats to a cheaper model, and hybrid orchestration cut Pathfinder’s token cost by more than half.
Datadog’s Thomas Sobolik supplies the operational detail for the single biggest of those levers, and opens with the statistic that justifies it: as of March 2026, 69% of all input tokens observed in Datadog customer traces were system prompts. That is the most cacheable payload in the stack, and the pricing mechanics decide whether caching pays. Anthropic charges cache writes at 1.25x the base rate at a five-minute TTL and 2x at one hour, with reads at 0.1x, and supports up to four explicit cache breakpoints ordered tools, then system, then messages — so a breakpoint placed after volatile content silently invalidates everything downstream of it. OpenAI caches automatically at prompts of 1,024 tokens or more, with newer models accepting an explicit prompt_cache_breakpoint per block. The reason to monitor rather than assume is that cache hit rate is a function of prompt stability, and prompt stability is a thing your own engineers change weekly without telling anyone.
Elastic’s Sunile Manjee explains the paradox in the headline — token prices fell 75% over the past year and bills went up anyway — and his diagnosis is structural: “Agentic AI costs are fundamentally a control problem rather than a token pricing problem.” Agentic workflows consume 5–30x more tokens than a comparable chatbot task, and a 2026 audit of 30 production engineering teams attributed 62% of the total inference bill to context and lack of guidance rather than to model price. Two supporting numbers make the variance vivid: token cost varies by up to 30x between identical runs of the same task, and the Stanford Digital Economy Lab figure he cites has agentic coding costing up to 1,000x more tokens than a simple code-chat exchange. The organisational context is just as unhelpful — 81% of enterprises run three or more models and 88% use two or more providers, only 23% of AI projects launched in the past year were fully deployed and meeting their original ROI objectives, and while 85% of enterprise IT organisations plan to implement LLM observability, just 8% have completed it. A 30x spread between identical runs is not a pricing problem you can negotiate; it is an instrumentation gap.
Which makes Datadog’s own ledger the most valuable foundational read on the list, because it shows what closing that gap returns. Datadog cut its monthly AI spend by more than $1 million, and the largest single line is a routing decision: moving internal coding work from Claude Opus to Claude Sonnet saved $687,000 a month at a measured 8% loss in proficiency for a 36.7% cost reduction. Dropping the Claude Code CLI effort level from high to medium saved another $288,000 a month. A cost-alert rollout returned more than $150,000 in its first seven days, with 768 distinct users triggering alerts in that week — evidence that most overspend is unwitting rather than deliberate. And Headroom, Datadog’s open-source context-optimisation tool, piloted with more than 1,000 engineers over a one-week snapshot, cut input tokens 39.3%, output tokens 35.7%, tool-result size 15.4% and cost per user 27.0%, with an internal evaluation showing a 47% cost reduction; the team ran more than 140 different evaluations on its agent evaluation platform to keep those trades honest. The team’s own summary is the transferable part: “Similar to rightsizing cloud infrastructure, tuning the configurations of AI tools — such as model type and effort level — can yield cost savings without hurting performance objectives.” The 8% proficiency figure is what makes it a decision rather than a slogan; without a measured quality delta, a model downgrade is a guess.
Sources: The New Stack (the systems guide to production token optimization) · Datadog (monitor prompt caching to optimize token usage) · Elastic (why your AI bill tripled while token prices fell 75%) · Datadog (how Datadog saves over $1 million each month)
4. Broadcom builds the on-prem AI estate, and gives agents an identity layer
The Next Platform · TechTarget · September 1–2, 2026
At VMware Explore 2026 on 2 September, Broadcom made the largest structural bet of the week: that production inference is moving back inside the data centre and that VMware should be where it lands. VMware Private AI Cloud and VMware AI Factory arrive on VMware Cloud Foundation 9, alongside VMware AI Assistant, Tanzu, vDefend, the Avi Load Balancer and TrueSource. AI Factory is the interesting half operationally — validated metal-to-model stacks built with Dell Technologies, Cisco Systems, Lenovo, Supermicro and AMD, using MetalSoft for bare-metal orchestration, with AMD Instinct MI350 Series GPUs and the ROCm software platform supported. Models named as served on the platform include NVIDIA Nemotron 3, Google DeepMind Gemma 4 and Alibaba Qwen 3.7-Max. Prashanth Shenoy, VP of marketing for Broadcom’s VMware Cloud Foundation Division, gives the thesis in a sentence: “They want to bring data to the model and not model to the data.”
The repatriation figures Broadcom cites are the argument underneath it: 56% of IT decision-makers are running or planning production inference in private cloud, 62% are concerned about costs, 51% are repatriating AI workloads over security concerns, and public-cloud share for these workloads has fallen 15% year over year to 41%. One hardware detail is worth pulling out for anyone sizing a private estate: NVMe memory tiering is said to reduce per-host costs by 42% — the same lever that makes an on-prem inference host cheaper than its GPU line item suggests. The market framing is the usual vertigo — global datacenter investment projected at $1.6 trillion by 2030, with tech enterprises spending $600 billion on AI infrastructure this year.
The complementary report puts a version history against the announcements, which is what a platform team actually needs. Seven items shipped: generally available now are Private AI Cloud on VCF, TrueSource, and the new AgentMinder — agent identity, runtime policy and observability in one component, which is the piece to read twice, because it is an infrastructure vendor claiming the control plane for non-human principals. Model-as-a-Service on VCF serves more than 150 open models on a vLLM runtime, including Nemotron 3, Gemma 4, Qwen3.8-27B, GLM-5.2 and NEC cotomi. AI-Ready Data Foundations in Tanzu Platform is slated for the fall 2026 release rather than shipping now. The dated lineage matters when you are judging maturity: NVMe tiering landed in VCF 9.0 in June 2025, GPU metrics in VCF 9.1 in May 2026, and agent buildpacks moved from an April 2026 tech preview to fully supported. Omdia principal analyst Torsten Volk’s read is that “these seven announcements answer the Omdia survey almost line by line” — the survey in question finding 69% of organisations currently seeking virtualization platform alternatives, which is the commercial pressure this release is answering as much as it is answering AI demand. If you are one of that 69%, the useful question is not whether the AI stack is credible but whether adopting it deepens exactly the dependency you were trying to reduce.
Sources: The Next Platform (VMware intros Private AI Cloud, AI Factory) · TechTarget (VMware wants to become the enterprise home for AI agents)
5. Agent-native platform engineering: 130,000 tasks a month, and a user who is not human
InfoQ · Datadog · August 25 – September 3, 2026
DoorDash’s Flux platform is the most concrete evidence yet of what agent-native platform engineering looks like once it is past pilot scale, and the numbers, reported by Leela Kumili, are operational rather than aspirational: 130,000 engineering tasks run through cloud-based agents in a single month in 2026, more than 25,000 automated code reviews weekly, and more than 300 YAML-based playbooks drawing more than 10,000 weekly invocations. The engineering choices behind those figures are the transferable part. Agent sandboxes run on Firecracker micro virtual machines rather than shared containers, tool access is mediated through an MCP gateway (Agent Gateway) rather than granting agents direct credentials, and the platform holds a 95th-percentile SLO of under five seconds for end-to-end sandbox setup — an SLO on the platform’s responsiveness to agents, which is a telling thing for a platform team to have written down. The comment quoted in the piece from Duy Nguyen of TOP GROUP Vietnam names the shift precisely: “Once agents handle background work, code review, internal tools, and concurrent execution, the hard problem shifts from model choice to control.” Three hundred playbooks is a governance surface, and 10,000 weekly invocations is a change-management problem wearing an automation costume.
Datadog shipped the small end of the same idea: workflows that can now be built and run from conversation rather than from the workflow editor. The paths are specific — Bits Chat; external coding agents such as Claude Code, Cursor and Codex working through the Datadog MCP Server; custom agents built in Bits Agent Builder; and the Datadog Slack app. That is narrower than “from AI agents” sounds, and the narrowness is the point: each path is a named, brokered integration rather than an open endpoint, which is the same architectural instinct as DoorDash’s gateway. The operational question to answer before enabling it is not whether an agent can author a workflow, but who reviews a workflow an agent authored, and against which runbook.
The foundational essay that frames all of it comes from Datadog’s platform-engineering side, by Candace Shamieh, Shlomo Benyaminov and James Eastham, and asks the right question: what does a golden path mean when the platform’s user is not human? Their anchor is Gartner’s 2026 Hype Cycle for Agentic AI introducing “agent experience (AX)” as a formal persona — which sounds like analyst vocabulary until you notice that every affordance a golden path offers a human (discoverable defaults, guardrails, a paved road that is easier than the alternative) has to be re-expressed as something a machine consumes: a schema, a tool description, a permitted action set. Their one hard number is a reminder that this is an efficiency problem as much as a governance one — a roughly 40% cost reduction in specific evaluation scenarios using field-selection tools, which is to say that telling an agent precisely which fields it needs is worth about as much as any model-level optimisation in this issue. If you run an internal developer platform, the cheapest useful exercise this quarter is to take your three most-used golden paths and ask what an agent would have to guess in order to use them.
Sources: InfoQ (DoorDash’s Flux runs 130,000 engineering tasks through cloud-based agents) · Datadog (build and run Datadog workflows from Bits Chat or AI agents) · Datadog (Golden Paths for AI agents)
6. What agents remember, what it costs to keep it, and how you improve them
AWS Machine Learning Blog · The New Stack · Datadog · September 1–4, 2026
The best-specified piece in this cluster is AWS’s guide to lifecycle policies for AgentCore memory, by Akarsha Sehwag, Himanshu Sah and Nicolo Cosimo Albanese, because it converts “agents should have memory” into defaults you can argue with. Episodic memory gets a 90-day TTL; semantic memory six to twelve months; the default prune window is 45 days; consolidation runs in batches of 10 memories; the relevance threshold sits at 0.3 on a 0.0–1.0 scale; and the scoring weights are recency 0.4, access 0.35, frequency 0.25. The whole thing runs as a nightly AWS Step Functions workflow, and the cost illustration is refreshingly small: roughly $0.01–$0.02 per nightly run for an agent with 1,000 memories where 20% score below threshold, rising to roughly $50–$100 per month at 100,000 memories. Those are not frightening numbers, which is exactly why they need a policy — unmanaged memory does not fail loudly, it accretes, and the retrieval quality degrades before the invoice does. Two of those defaults deserve local scrutiny: a 0.3 relevance threshold is a product decision about how much an agent is allowed to forget, and a 90-day episodic TTL is a compliance decision in any regulated context.
The persistence argument runs alongside it from a vendor with a horse in the race. Max Liu, co-founder and CEO of TiDB (PingCAP), makes the case that per-tenant databases are the hidden cost of agent-built software: when agents build, deploy and maintain applications, the number of database instances grows with tenants rather than with load, and the idle-cost trap — paying for provisioned capacity that mostly sits doing nothing — becomes the dominant line item. His production example is Kimi by Moonshot AI, and his architectural target is roughly one-second database provisioning, on the reasoning that if creating a database is instant and idle capacity costs nothing, per-tenant isolation stops being an economic problem. It is a vendor’s case for its own architecture, and it is also a real constraint that anyone letting agents spin up backing services will meet.
Datadog’s trace-to-experiment piece supplies the improvement loop, and it is a methodology essay rather than a launch — read it that way and it is genuinely useful. The argument is that production traces are the highest-quality source of evaluation cases you will ever have, and that most teams waste them: an agent thread that went wrong is a test case with ground truth attached, but only if you capture it, generalise it into a dataset, run a changed prompt or model against it, and compare. That is a loop, not a dashboard, and the discipline it demands is version control over prompts and datasets rather than any particular tool. The final piece in this cluster is forward-looking rather than reported: Vespa.ai is running a webinar on 24 September with GigaOm field CTO Whit Walters and Vespa’s Bonnie Chase, framed around Walters’ report “Defeating the Integration Tax” and the case that retrieval infrastructure is what determines whether agent deployments scale. Worth a diary entry if retrieval is on your roadmap this half.
Sources: AWS (designing lifecycle policies for AgentCore memory) · The New Stack (when agents build, deploy, and maintain, persistence becomes the hard problem) · Datadog (from traces to experiments) · The New Stack (retrieval engineering for scaling AI agents)
7. Observability practice: span anatomy, sampling strategy, and instrumentation you can score
Dynatrace · Grafana Labs · The New Stack · DevOps.com · August 27 – September 3, 2026
Every cost number in this issue depends on telemetry that is actually complete, and this week produced the groundwork for that. Amrith Raj, principal AI telemetry specialist at Dynatrace, wrote the clearest available explanation of what a span is made of — ten components, the span kinds, and the semantic conventions that make a span comparable across services, including the HTTP and GenAI operation conventions that matter most for anyone tracing model calls. It is grounded in the real CNCF project, referencing OpenTelemetry schema 1.26.0 and Java SDK 1.38.0, and the explanation is vendor-neutral even though the screenshots are Dynatrace Distributed Tracing and Playground. The reason to send it to your team is the semantic-conventions half: an attribute named by convention is queryable across every service that emits it, and an attribute named by a developer’s preference is a per-service dialect that quietly makes cross-service analysis impossible.
Grafana Labs turned the same concern into something measurable. Arpit Kumar describes the instrumentation quality report in Grafana Cloud Knowledge Graph, which grades services across five quality tiers, from Incomplete/Poor at 0–10% up to Perfect at 100%, and surfaces the result under Entity catalog > Instrumentation quality. The checks are the useful specification even if you never use the product: service graph metrics present, Kubernetes labels applied, service names validated, span metrics emitted. Those four are precisely the things that break silently and are discovered during an incident, and putting a score on them turns instrumentation from a task nobody owns into a number a team can be asked about in a review.
On the question of what to keep, The New Stack ran a short conversation with Sarah Hudspeth of Chronosphere laying out the three strategies teams actually choose between — head sampling, tail sampling and dynamic sampling — which is the right frame for the decision even at podcast length. The trade is structural rather than numeric: head sampling is cheap and decides before it knows whether the trace was interesting; tail sampling knows the outcome but must buffer to find out; dynamic sampling adjusts rates to what is happening. Set against Grafana’s scoring work, the sequencing advice writes itself — measure instrumentation completeness before you tune sampling rates, because sampling a badly instrumented service just makes the gap harder to see. DevOps.com’s contribution, by Sannan Ali, argues the cultural version of the same point: that teams are moving from monitoring toward understanding, and that the shift comes from linking logs, metrics and traces together and reading them alongside deployment context rather than from adding another dashboard. It is a mindset piece rather than an architecture one, and its value is as a way to explain to non-specialists why the correlated view is worth paying for.
What SREs report they are actually doing closes the loop. Dynatrace’s State of SRE 2026 research, written up by Klint Finley, finds 67% of SRE respondents now monitor AI models and 58% say monitoring AI performance is among their most-used capabilities — a profession redefined around a workload most job descriptions still do not mention. On service levels the picture is split: 55% report wide SLO use across the organisation while nearly 90% use SLOs in at least some systems, which is the classic shape of a practice that has been adopted where it was easy and stalled where it was contested. Treat these as Dynatrace’s research findings rather than settled industry fact, and use them the way survey data is genuinely useful — as a prompt to ask which of your own AI services currently has an SLO that someone would be paged against.
Sources: Dynatrace (anatomy of an OTel span) · Grafana Labs (measure and improve instrumentation quality) · The New Stack (finding failures without drowning in tracing data) · DevOps.com (from monitoring to intelligent system understanding) · Dynatrace (AI is changing the reliability game for SREs)
8. Agents inside the blast radius: identity across clusters, remediation within them
NVIDIA Developer Blog · SiliconANGLE · September 1–3, 2026
NVIDIA’s Bhagat Khemchandani and Rohan Somvanshi published the least glamorous and most immediately reusable pattern of the week: carrying a user’s identity across federated Kubernetes clusters and AI platforms without making them log in again at every hop. The construction is deliberately boring — OpenID Connect for authentication, a shared Redis session store, stateless data-plane gateways so any gateway can serve any request, and a small identity-validation API sitting between them — and the single reported result is a 55% reduction in repeated login events across NVIDIA internal developer platforms spanning Kubernetes clusters in AWS and OCI. The reason it belongs in an AI-ops bulletin rather than an identity one is what sits on the other end of those hops: when an agent or a notebook calls a model endpoint in another cluster, the question of whose identity is being carried decides whether your audit trail records a person or a service account. Stateless gateways plus a shared session store is the shape that makes the answer “the person”.
At the other end of the autonomy spectrum, DataAgent Ltd. launched on 1 September with $10 million in pre-seed funding from MizMaa Ventures and Alicorn Venture Partners, aiming an agent at fixing production faults inside Kubernetes clusters rather than merely reporting them. The founders carry relevant history: CEO Ishay Yaari and CTO Nati Shalom both came from Cloudify Platform, acquired by Dell Technologies in 2023 for about $100 million. The company was founded in January 2026 and is based in Israel, so this is a launch and a thesis rather than a track record. The thesis is the interesting part, and Yaari states it sharply: “When a vendor’s revenue is your data ingest, it cannot cut your bill without cutting its own.” The commercial model follows from it — the agent itself is open source and free, with a paid SaaS tier for fleet management and orchestration — and the company says its approach can deliver up to a 90% reduction in observability costs, a figure it has published on its own behalf and which no independent evaluation yet supports. The structural argument about misaligned incentives in ingest-priced observability is worth taking seriously regardless of whether this particular company is the answer; the autonomous-remediation claim is the one to pilot in a non-production cluster and measure yourself.
Sources: NVIDIA (carrying user identity across federated Kubernetes and AI platforms) · SiliconANGLE (DataAgent raises $10M)
Calls to action
- Measure your own cold start, phase by phase. AWS found six sequential phases in eight minutes, and which one dominates depends on model size — 53 seconds of compile on a 64 GB model, 423 seconds of weight loading on a 203 GB one. Time node provisioning, driver init, image pull, weight load and compile separately before you optimise any of them, because at $55 an hour for a p5.48xlarge you are paying full accelerator rate for every one of those minutes.
- Set your concurrency ceiling from a latency measurement, not a utilisation graph. Google Cloud’s TPU benchmark caps concurrent requests at 64 per replica and autoscales on end-to-end latency rather than CPU or memory. If your HPA currently watches accelerator utilisation, it will keep reporting healthy while the experience your users have has already collapsed.
- Split your workloads into prefill-heavy and decode-heavy before choosing a model size. On classification, Gemma 3 12B and 27B scale almost alike (6.37x vs 6.04x at 128 users). On generation, the 27B model plateaus at 4.12x while the 12B reaches 8.19x. One model applied across a mixed workload is systematically wrong in one direction.
- Audit what fraction of your input tokens is system prompt. Datadog observed 69% across customer traces as of March 2026. That is the most cacheable payload you have — and with cache reads at a tenth of base rate, the difference between a stable prompt prefix and one your engineers edit weekly is most of your input bill.
- Put a measured quality delta next to every model downgrade. Datadog’s Opus-to-Sonnet move saved $687,000 a month at a measured 8% proficiency loss for a 36.7% cost reduction. Without that second number a downgrade is a guess, and the first team to notice will be the one whose output got worse.
- Give agent memory a written lifecycle policy. Start from AWS’s defaults — 90-day episodic TTL, six to twelve months semantic, a 45-day prune window, relevance threshold 0.3 — then decide locally, because the threshold is a product decision about what an agent may forget and the TTL is a compliance decision in any regulated context.
- Score your instrumentation before you tune sampling. Grafana’s five-tier report checks service graph metrics, Kubernetes labels, service name validation and span metrics — the four things that break silently and get discovered mid-incident. Sampling a badly instrumented service only makes the gap harder to see.
- Broker agent access rather than granting it. DoorDash routes tool access through an MCP gateway and runs sandboxes on Firecracker microVMs; Datadog exposes workflow authoring through named, brokered paths. The pattern is the same: a mediated integration you can revoke and audit, not credentials handed to an agent.
|