This week at a glance
Observability vendors moved further into AI this week. Dynatrace completed its acquisition of Arize, the AI tracing and evaluation platform behind open-source Phoenix and enterprise AX. The press release gives no price; The New Stack puts it at $915 million. Honeycomb opened early access to a fleet-level view of AI agents, and Cloudflare published actual observability prices ($0.25 per GB ingested and $0.10 per GB-month stored, effective December 1). Palo Alto Networks launched Cortex XCOR, built on Chronosphere, with an AI SRE agent. Palo Alto says it finds the root cause 75% of the time in under three minutes on average, but the launch post gives no sample, environment or method for any of its percentages.
The strongest evidence came from practitioners. Trust Bank cut incident triage from 15–20 minutes to about two with agents on Amazon Bedrock AgentCore. About 65% of the agents’ root-cause analyses are actionable, and the bank runs 180+ microservices with three SRE engineers. incident.io spent two years building its own investigations agent and explained how it scores the agent against past incidents. Atlassian moved a metrics pipeline handling 4.8 billion data points a minute onto the OpenTelemetry Collector without changing any application. In a separate post, Atlassian said it cut incident-detection latency from 40+ seconds to under 10, and running costs from about $20,000 to $650 a month. On cost, McKinsey’s figures say per-token prices fell about 90% while agentic work uses 5–30x more tokens per task, and Gartner says the real cost of an outcome includes every failed attempt. The same week had two reliability failures. OpenAI ran degraded for 5 hours 22 minutes across 30 components, and an Azure maintenance job disrupted hybrid connectivity in 18 regions.
On our watch list
- OpenAI’s root-cause analysis for the September 29 incident. OpenAI promised it within five business days, which means by October 6. The incident hit 12 API components, 14 ChatGPT surfaces and all four Codex components, so the RCA should show what those services share. If you build on the Agents API or Codex, it will tell you how far that shared failure reaches.
- Microsoft’s post-incident review of the Azure servicing event. So far Microsoft has only linked the incident to “infrastructure operating system servicing activity.” Watch whether the review explains why network management components failed to recover automatically. Also watch whether Microsoft changes how it rolls out maintenance to ExpressRoute and VPN gateways.
- New Relic Now on October 6. New Relic’s pre-event post named Compound Alerts, Ground Truth, Smart Alerts and Autopilot but gave no numbers. Watch for availability dates and pricing, and for whether Autopilot moves from assisting investigations to acting on its own.
- A timeline for Arize inside Dynatrace. The release says only that Arize capabilities will be integrated “over time.” Watch for the first combined release, and for any change to how Phoenix is licensed or governed. Phoenix is the open-source piece many teams already run on their own.
- Independent results for Cortex XCOR’s AI SRE. The 75% root-cause rate, the further 19% judged useful and the 89% data reduction come with no stated method. Watch for a customer case study or an analyst evaluation that explains how “success” is graded. incident.io has published its own 0–100 grading scale, which is one possible yardstick.
- Price and general availability for the AWS Well-Architected Agent. It is in preview in three US regions and requires an AWS Support plan. No price has been announced. Watch whether general availability brings automatic remediation, since today it only recommends changes.
- Whether the open-weight shift appears in spending data. McKinsey recommends running 80–85% of workloads on open-weight models and 10–15% on frontier models. Watch earnings commentary from frontier-model API sellers and from inference platforms for evidence that the mix is changing.
- CPU capacity for agent workloads. The Pragmatic Engineer reports CPU spot discounts disappearing, server lead times around six months and CPU prices up 10–20%, driven partly by agent tool use and reinforcement learning. Watch the hyperscalers’ next earnings calls for CPU capacity guidance.
- Pricing for DigitalOcean Managed Agents and Honeycomb AI Ecosystem. Both are in preview or early access, and neither has published a price. Pricing will show whether hosting agents is sold per session, per tool call or per GB.
- Whether Atlassian’s detection system covers more major incidents. Its Flink-based detector reached 86% recall on in-scope incidents but covered only 30% of all major incidents because of gaps in instrumentation. Watch for a follow-up showing that coverage figure rising.
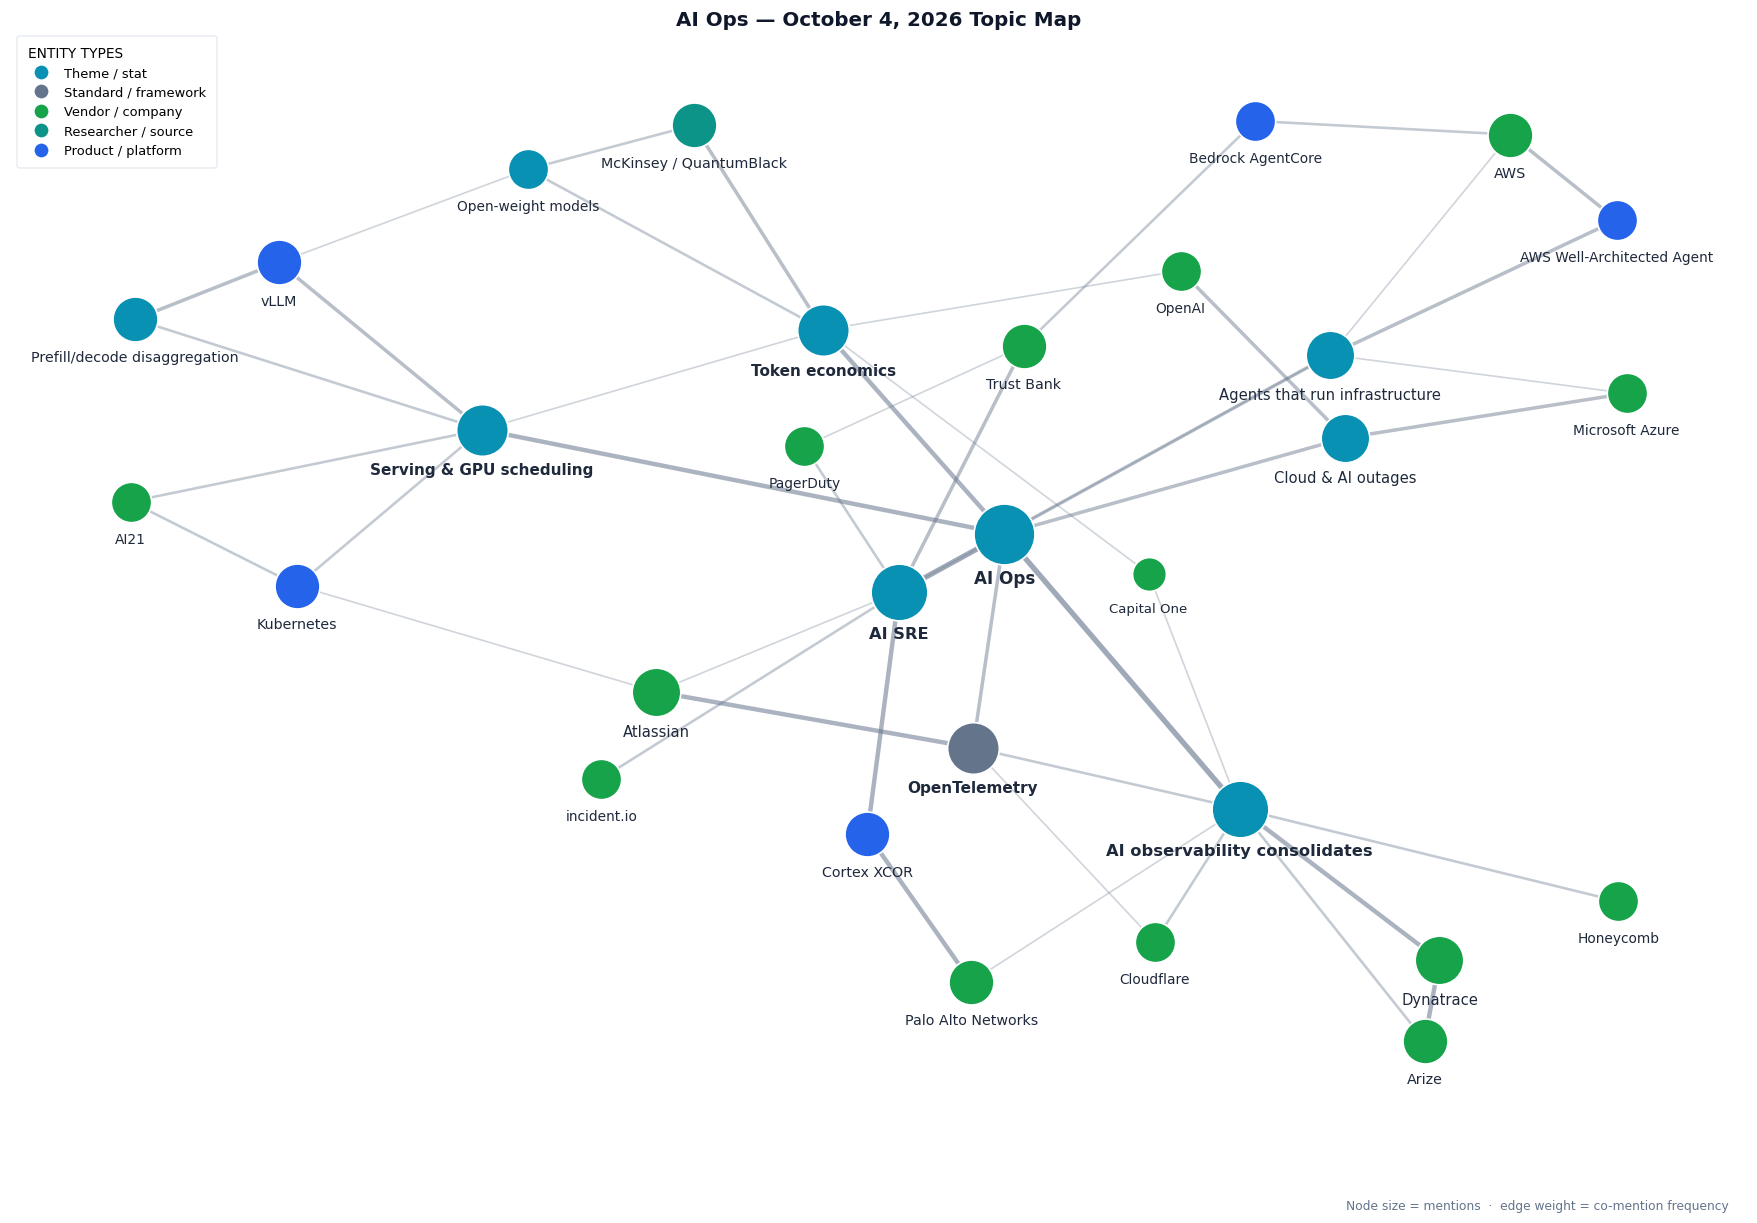
This week’s topic map. AI observability and AI SRE sit at the centre: Dynatrace–Arize, Honeycomb and Cloudflare on one side, Cortex XCOR, Trust Bank, incident.io and PagerDuty on the other. Atlassian connects them through OpenTelemetry. The serving cluster links vLLM’s prefill/decode guide with Kubernetes GPU scheduling at AI21. Token economics links McKinsey’s open-weight recommendation back to inference. The OpenAI and Azure incidents sit next to the AWS Well-Architected Agent under agents that run infrastructure.
View interactive topic map →
Article index
25 articles, grouped by sub-theme. Twenty-one are from this week’s coverage window (September 27 to October 4). Four are longer foundational reads on the beat. Sponsored coverage, vendor blogs and press releases are labelled within each group.
AI observability consolidates
Agent traces, evaluations and LLM spend are moving into general observability platforms, by acquisition and by product. Every row here is published by a vendor. The Dynatrace item is a press release with no deal value. Honeycomb’s AI Ecosystem is in early access with no price. New Relic’s post previews its October 6 event and gives no figures. Cloudflare’s post is the only one with published prices.
AI SRE: the claims and the build
One launch, one customer with production numbers, and three accounts of building agents for incident response. The Cortex XCOR figures are Palo Alto’s own and come with no method. The Trust Bank figures come from the bank’s CTO, as reported by Computer Weekly. The incident.io and PagerDuty posts are engineering blogs from the vendors. The InfoQ panel includes Groundcover’s field CTO.
Telemetry pipelines rebuilt on OpenTelemetry
Two separate Atlassian projects: a metrics pipeline moved onto the OpenTelemetry Collector, and a faster incident-detection system. The CNCF post is a member post written by Atlassian.
Serving and scheduling AI compute
Practical inference serving, GPU scheduling on Kubernetes, and a shortage of CPUs as well as GPUs. The vLLM guide is by an IBM Research engineer. The AI21 post is written by AI21 staff on Google Cloud’s blog. The SiliconANGLE row is theCUBE event coverage paid for by CoreWeave. Despite its headline, it covers Cognition’s always-on training and CoreWeave’s Forge launch.
Token economics and where AI runs
The cost of agentic work, and how it shapes model choice and deployment. The Computer Weekly figures come from McKinsey and from other surveys McKinsey cites. The SiliconANGLE row is theCUBE event coverage paid for by Dell.
Clouds, outages and agents that run infrastructure
Two reliability failures, and two launches that hand more infrastructure work to agents. Root causes for both outages had not been published at press time. The AWS agent recommends changes but does not make them.
Detailed write-ups
1. Dynatrace closes Arize as observability vendors move into AI
Dynatrace / Honeycomb / Cloudflare · September 29 – October 2, 2026
Dynatrace completed its acquisition of Arize, an AI observability and evaluation platform, on October 1. Arize has two products, open-source Phoenix and enterprise AX, and both will stay supported during integration. The release commits to no date: “Over time, Arize capabilities will be integrated into Dynatrace, giving customers a unified AI observability experience.” It also gives no price. The New Stack reports that the deal was announced in mid-August at $915 million. IDC’s Stephen Elliot is quoted in the release: “As agents multiply across enterprises, the importance of observability has risen.”
Two other vendors shipped along the same lines. Honeycomb opened early access to AI Ecosystem. It shows agent failure rates, latency and volume across a whole fleet, and estimates LLM spend per agent and per model from public price lists. It reuses span data that agents already send to Honeycomb’s Agent Timeline, so no new instrumentation is needed. No price has been published. Cloudflare released eight observability updates, with prices attached. They include a single logs view now generally available, Cloudflare Traces in open beta with OpenTelemetry export, and a beta SQL API reachable through an Observability MCP server. Unified pricing starts December 1, 2026: 50 GB of ingestion and 10 GB-month of storage are included, then $0.25 per GB ingested and $0.10 per GB-month stored.
For background on why AI telemetry is expensive, Honeycomb’s foundational post argues that ingest and query compute drive cost more than storage does. High-cardinality fields such as prompts get stored three times when metrics, logs and traces are kept separately.
Sources: Dynatrace (completes acquisition of Arize, press release) — https://www.dynatrace.com/news/press-release/dynatrace-completes-acquisition-of-arize/ · Honeycomb (introducing AI Ecosystem) — https://www.honeycomb.io/blog/introducing-ai-ecosystem · Cloudflare Blog (8 major updates to Cloudflare Observability) — https://blog.cloudflare.com/one-observability-platform/ · Honeycomb (wide events vs. three pillars) — https://www.honeycomb.io/blog/wide-events-vs-three-pillars-ai-observability-costs
2. Cortex XCOR: Palo Alto’s AI SRE claims, without a method
Palo Alto Networks · October 1, 2026
Palo Alto Networks launched Cortex XCOR, an AI-native observability platform. The announcement was written by Martin Mao, co-founder of Chronosphere, six months after Palo Alto acquired Chronosphere. Mao says Chronosphere’s cost-optimisation technology remains “a major pillar of XCOR.” The acquisition of Embrace adds real user monitoring and synthetic monitoring.
The AI SRE agent is the main claim. Palo Alto says it finds the root cause in 75% of incidents in complex production environments, and gives operators useful analysis in a further 19%. It says the agent finishes an investigation in under three minutes on average, compared with a manual response that “can take 20 minutes just to locate the relevant issues.” Customers reportedly reduce their observability data by an average of 89%. The post gives no sample, environment, time period or grading method for any of these figures, and no general-availability date or price. OpenAI, DoorDash and Compass are named only in a passage about cost efficiency, and none of them is quoted. Treat the numbers as targets to test in a proof of concept, not as benchmarks.
Sources: Palo Alto Networks (introducing Cortex XCOR, vendor blog) — https://www.paloaltonetworks.com/blog/2026/10/observabilitys-ai-moment-introducing-cortex-xcor-ai-driven-observability-for-autonomous-response-with-ai-sre/
3. Trust Bank: agent triage in production, with numbers
Computer Weekly · September 30, 2026
Trust Bank cut incident triage from 15–20 minutes to about two minutes with AI agents built on Amazon Bedrock AgentCore. It uses Anthropic’s Claude Opus 5 for reasoning and Claude Haiku for simpler tasks, with PagerDuty handling incident response and Sumo Logic handling monitoring. The bank launched in September 2022 with 50 microservices. It now runs more than 180 and ships more than 100 changes a week, with three SRE engineers and a cloud operations team that keeps two engineers on shift around the clock.
The detail worth taking away is that about 65% of the agents’ root-cause analyses are actionable. That is a real production rate, and it also means roughly a third are not. CTO Srinivas Patil describes the effort as a matter of staffing: “This is not an innovation exercise for us. This is a survival exercise for us.”
incident.io explains what it takes to build such an agent. Its Investigations product took two years after a November 2024 prototype. The agent pulls deploys, telemetry and Slack data in parallel, forms hypotheses, then checks them adversarially before showing anything. Testing runs against frozen historical incidents graded 0, 35, 65 or 100, and a nightly job re-checks the agent’s stored memories against recent incidents. PagerDuty describes a similar change: it replaced a single agent with a multi-agent design that tests hypotheses in parallel, while keeping event-to-notification reliability at 99.9981%.
Sources: Computer Weekly (Trust Bank cuts incident triage time) — https://www.computerweekly.com/news/366651387/Trust-Bank-cuts-incident-triage-time-to-two-minutes-with-AI-agents · incident.io (building Investigations) — https://incident.io/blog/building-investigations-what-it-takes-to-build-an-ai-sre · PagerDuty (swapping a product engine mid-flight) — https://www.pagerduty.com/eng/swapping-a-product-engine-mid-flight/ · InfoQ (beyond observability, panel) — https://www.infoq.com/presentations/ai-production-operations/
4. Atlassian rebuilds two telemetry systems on OpenTelemetry
InfoQ / CNCF Blog · September 29–30, 2026
Atlassian moved its metrics pipeline from gostatsd to OpenTelemetry Collector distributions across collection, ingest, aggregation and forwarding. The pipeline takes data from about 100,000 hosts in 14 regions, ingests about 4.8 billion data points a minute and stores about 220 million after aggregation, a 96% reduction. The team kept the StatsD-over-UDP interface so that application teams did not have to change anything. In the engineers’ words: “We kept the interface and rebuilt everything behind it, which turned an org-wide migration into a platform-team migration.” Merging the metrics and tracing sidecars cut average CPU per service by 3.9%, which Atlassian puts at about 30% fleet-wide cost reduction for collection. The new aggregation tier uses about half the CPU of the old one. Retiring the old aggregation layer and proxy removes about 38% of the metrics cluster’s CPU requests. The 99.95% SLO held throughout, and Atlassian open-sourced its delta aggregation processor.
In a CNCF member post, Atlassian’s Deepak Biswas describes the second project, an incident detector rebuilt on Apache Flink (four pods on Kubernetes), Kafka and OpenTelemetry. Event-to-metric latency fell from 40+ seconds to under 10. Running cost fell from about $20,000 a month (around 90 VMs of Node.js aggregators) to about $650. The post is also candid about limits: recall on in-scope incidents peaked at 86%, but the detector covered only 30% of major incidents, because many services were not instrumented. Biswas frames the goal as answering “who noticed first, the monitoring or the customers?”
Sources: InfoQ (Atlassian rebuilds metrics pipeline around OpenTelemetry) — https://www.infoq.com/news/2026/09/atlassian-opentelemetry/ · CNCF Blog (from 40 seconds to under 10, member post) — https://www.cncf.io/blog/2026/09/30/from-40-seconds-to-under-10-rebuilding-incident-detection-on-opentelemetry-apache-kafka-and-apache-flink-on-kubernetes/
5. vLLM explains when to split prefill from decode, and when not to
vLLM Blog · September 29, 2026
IBM Research’s Martin Hickey wrote a practical guide to disaggregated serving in vLLM. It separates prompt processing (prefill), token generation (decode) and CPU work such as tokenisation, so that long prompts stop slowing down other requests. Hickey’s summary: “Prefill reads the whole prompt in one pass, is limited by compute and sets your time to first token (TTFT). Decode is the opposite.” The guide covers the KV-transfer connectors (NIXL, LMCache, Mooncake, FlexKV and AMD’s MoRI-IO, plus a MultiConnector that chains them) and the flags that assign each worker its producer or consumer role.
His own test was small: Qwen2.5-7B-Instruct on two Nvidia L40S GPUs over PCIe, with ~8k-token prompts. When prefill and decode shared the same GPUs, p99 inter-token latency rose from 23 ms to 169 ms at just 0.4 requests a second. With the two split, it stayed between 25 and 52 ms. He also cites other results. AMD ran Qwen3-235B on 8× MI300X, and 73 of 100 requests met both latency targets, against 30 of 100 without the split. llm-d reports 59% lower mean latency for gpt-oss-120b on 16 H200s. The guide’s most useful section says when not to split. Stay with shared GPUs when time to first token is the binding constraint, when KV transfer is slow (PCIe without peer-to-peer), or when traffic is light or bursty.
Two related reads cover scheduling. AI21 cut start times for high-priority jobs from 72 hours to 12 on GKE with Kueue. Manual interventions went from 20 a week to zero, and total cost did not change. Zhuoyu Technology’s CNCF case study reports GPU allocation above 95% using Koordinator and HAMi.
Sources: vLLM Blog (taking vLLM apart) — https://vllm.ai/blog/2026-09-29-disaggregated-serving-guide · Google Cloud Blog (AI21 time-to-start, customer-authored) — https://cloud.google.com/blog/products/containers-kubernetes/ai21-trains-its-models-on-ai-hypercomputer · CNCF (Zhuoyu Technology case study) — https://www.cncf.io/case-studies/zhuoyu-technology/
6. Cheaper tokens, bigger bills: the case for open-weight models
Computer Weekly / TechTarget · September 30 – October 1, 2026
McKinsey’s Sachin Chitturu (QuantumBlack) sets out the arithmetic. Per-token prices have fallen about 90% since 2023, but agentic models use 5–30x more tokens per task, according to Silicon Data figures he cites. A FinOps survey he also cites found 93% of enterprises overspent their AI budgets in the past six months. In McKinsey’s own survey, one in five respondents had cut back AI use because of running costs. 80% report individual productivity gains, but only 37% see a positive effect on EBIT. McKinsey’s recommendation is to run 10–15% of workloads on frontier models and 80–85% on open-weight models. Open-weight models cost about $1–$6 per million output tokens, against $10–$50 for frontier APIs.
TechTarget explains why counting tokens is not enough. Gartner’s Will Sommer: “The cost of the relevant outcome must include all of the failed attempts to achieve that outcome.” Forcepoint X-Labs’ Jyotika Singh adds that cost depends on how many downstream tool calls a request triggers, not on prompt size. Uber measures cost per completed task alongside precision and recall for its code-review agents. Two event pieces round out the picture. At a Dell event (theCUBE coverage paid for by Dell), speakers said token budgets are pushing some workloads back on-premises. Capital One says it builds policy and runtime controls into its platforms before teams build agents, and tracks agent trajectories, tool accuracy and end-to-end latency.
Sources: Computer Weekly (token bills to push workloads onto open-weight models) — https://www.computerweekly.com/news/366651239/Token-bills-to-push-most-enterprise-AI-workloads-onto-open-weight-models · TechTarget (token counts tell CIOs less) — https://www.techtarget.com/it-strategy/news/366651327/Token-counts-tell-CIOs-less-as-AI-agents-do-more · SiliconANGLE (enterprise AI deployment strategy, Dell-sponsored theCUBE coverage) — https://siliconangle.com/2026/09/29/enterprise-ai-deployment-strategy-shaped-cost-control-dellaileadershipsymposium/ · CIO Dive (Capital One’s agentic AI strategy) — https://www.ciodive.com/news/capital-one-agentic-ai-strategy/831435/
7. Two outages, both still without a root cause
MIXED / The Register · October 1, 2026
OpenAI’s status page shows that its September 29 incident ran from 17:52 to 23:14 UTC, 5 hours 22 minutes, across 30 components. Those were 12 API components including Chat Completions and the Agents API, 14 ChatGPT surfaces, and all four Codex components (web, API, CLI and VS Code extension). OpenAI classed it as “degraded performance,” not an outage, even though users saw failed requests, login failures and tasks that did not finish. The status page repeated the same update four times: “We have applied the mitigation and are monitoring the recovery.” OpenAI promised a root-cause analysis within five business days.
A day later, Azure infrastructure maintenance disrupted ExpressRoute Gateway, VPN Gateway and Azure VMware Solution in 18 regions, starting at 20:30 UTC on September 30. Microsoft later added Azure Firewall, Application Gateway and Web Application Firewall to the list. Microsoft “paused the infrastructure servicing activity” and has so far only linked the event to operating-system servicing. Some VPN gateways lost redundancy rather than connectivity. Some network-management components did not recover on their own and had to be restored from healthy instances. Microsoft declared the incident mitigated at 03:30 UTC on October 1. Hybrid-cloud customers should note that their private links to Azure went through the same maintenance process that caused the failure.
Sources: MIXED (OpenAI’s September 29 outage) — https://mixed-news.com/en/openai-september-29-outage-30-components/ · The Register (Azure maintenance mess) — https://www.theregister.com/off-prem/2026/10/01/azure-maintenance-mess-disrupted-hybrid-clouds-vpns-cloudy-vmware-services/5300333
8. AWS turns Well-Architected into an agent, and DigitalOcean hosts agents
The Register / InfoQ · October 2, 2026
AWS released the Well-Architected Agent in preview on October 1. AWS presents it as the successor to Trusted Advisor and the Well-Architected Tool, and says it evaluates environments “as an experienced cloud architect would.” It checks environments against best practices for more than 65 AWS services and covers cost, security, performance and resilience. Findings are ranked by the business goals the customer sets, by impact and by effort. Resource-level findings carry a dollar impact where one applies. Architecture-level findings come with infrastructure-as-code changes for Terraform, CloudFormation or CDK. Fixes are delivered as SSM runbooks, CLI scripts or console walkthroughs, and the agent does not apply them itself. It runs from three US regions, accepts workloads from any commercial region, and requires an AWS Support plan. No price has been announced.
DigitalOcean launched Managed Agents in public preview. It combines a Harness Runtime of isolated microVMs with an Action Gateway to more than 16,000 external tools. It supports Claude Code, Codex CLI, OpenCode, Hermes and LangGraph agents, and sensitive actions can require human approval. No pricing has been published.
Sources: The Register (AWS Well-Architected agent) — https://www.theregister.com/off-prem/2026/10/02/aws-turns-its-best-practice-framework-into-an-agent-that-recommends-cloudy-reconfigs/5300730 · InfoQ (DigitalOcean Managed Agents) — https://www.infoq.com/news/2026/10/digitalocean-managed-agents/
9. CPUs are now short too, and training never stops
The Pragmatic Engineer / SiliconANGLE · September 24 – October 1, 2026
The Pragmatic Engineer’s Gergely Orosz reports that CPU spot discounts, once up to 90%, have disappeared across AWS, GCP and Azure. He reports servers taking about six months to deliver instead of one to two weeks, and CPU prices up 10–20%. He attributes the demand to agents compiling, testing and linting code, and to reinforcement learning. turbopuffer CEO Simon Eskildsen: “RL needs a lot of CPUs.”
At CoreWeave’s Fully Connected event, in theCUBE coverage paid for by CoreWeave, Cognition’s Silas Alberti said: “Our runs are always on. While we still ship releases, I think the reality is we’re always training.” Cognition runs training across data centres on several continents, which requires 99.99% reliability across thousands of GPUs. CoreWeave used the event to announce Forge, which links inference, agent tracing (Agent Lens), distillation and reinforcement-learning rollouts. Last week we listed Fully Connected as a watch item; Forge is what came out of it.
Sources: The Pragmatic Engineer (a new trend of CPU shortages) — https://newsletter.pragmaticengineer.com/p/the-pulse-a-new-trend-of-cpu-shortages · SiliconANGLE (always-on AI agents, CoreWeave-sponsored theCUBE coverage) — https://siliconangle.com/2026/10/01/cognition-scales-ai-agent-infrastructure-coreweave-fullyconnected/
Calls to action
- Measure what share of your agent root-cause analyses are actionable. Trust Bank reports about 65%. Grade a sample of your own agent’s findings against past incidents, using a fixed scale like incident.io’s 0/35/65/100, before you rely on the agent for first response.
- Ask AI SRE vendors how they define success before you run a trial. When a vendor quotes a root-cause rate, such as Cortex XCOR’s 75%, ask for the incident sample, who graded the results, and what counted as correct. Then run the agent against your own frozen incidents.
- Check whether you need disaggregated serving before you build it. Following the vLLM guide, check peer-to-peer GPU topology (
nvidia-smi topo -p2p r) and whether your binding SLO is time to first token or inter-token latency. If transfers run over plain PCIe and TTFT is the constraint, keep prefill and decode on the same GPUs.
- Report AI cost per completed task, including failed attempts. Add tool-call counts and retries to your AI cost dashboards alongside token volume, as Gartner and Uber’s practice suggest. Then test which workloads could move to an open-weight model.
- Check redundancy on your hybrid links. After the Azure event, confirm that ExpressRoute and VPN gateways have tested secondary paths. Check gateway health and BGP state yourself instead of relying on the status page.
- Don’t let your agents depend on a single AI provider. The OpenAI incident degraded the API, ChatGPT and Codex together. If any production workflow calls the Agents API or Codex, set up fallback behaviour and alerting on its failure rate now.
- Re-cost your telemetry against published prices. Cloudflare’s rates take effect December 1, 2026. Compare your current ingest and retention against $0.25 per GB ingested and $0.10 per GB-month stored before the change.
|