This week at a glance
The honest summary of this week is that the AI-operations beat produced a great deal of argument and very little measurement, and the two are easy to confuse when both arrive as blog posts. Five items carry numbers that someone actually measured. AWS shipped PREFIX_AWARE routing to general availability on SageMaker Inference and published a benchmark: on 8,000-token shared prefixes, P50 time-to-first-token fell 71–77% and KV cache hit rate went from roughly 25% to 82% — but on short contexts throughput improved only 1.7–2.0%, and every figure is AWS’s own, run on seven ml.p5.48xlarge instances with no third-party verification. Netflix took Conductor from a memory-bound ceiling to 420 million workflow executions a month across 200,000 workflow definitions, with maximum workflow size up roughly 10x to 30,000 tasks and failed lock acquisitions down from about 2,700 per interval to essentially zero. Two Adobe engineers writing for the CNCF showed a per-tenant GPU metrics design that cut a tenant view from 10,000+ time series to about 300 — a ~97% cardinality reduction — after finding a GPU sitting idle at 0% utilisation for 11 straight days. A Salesforce engineer, writing about incidents at a previous employer, described a pipeline that passed every job-level check for 11 days while producing audience counts that were ~40% wrong. And OpenAI’s own August publication reports 3.1 agent-workdays per human workday, inference cost per researcher ranging from a $600/day median to $7,000/day at the 90th percentile, and human intervention required on more than 50% of successful four-to-eight-hour tasks.
The rest of the issue needs labels more than it needs summarising. Two posts on The New Stack are paid placements: “It passed CI. It passed your evals.” is sponsored by Dynatrace and written by a Dynatrace employee, and its trace timings are an illustrative worked example rather than production data; “Observability has a data problem” is sponsored by Bronto, and its headline claims — 100x more data retained, 12 months of full-fidelity retention, sub-second search across petabytes — are Bronto product claims. Two APMdigest pieces are vendor columns with no disclosure on the page: “The SIEM Isn’t the Problem” is by Bindplane’s CEO and co-founder, Mike Kelly, whose “40%+ telemetry volume reduction” is a claim for Bindplane’s own product category; “Your AI Pipeline May Have a Document Observability Problem” is by Jeff Sidell, CTO of the OCR vendor 8am, and contains no numbers whatsoever. Dynatrace appears three times — the sponsored post, a platform-engineering blog and a Cursor plugin announcement — and the first two draw on the same Dynatrace-commissioned 2026 State of SRE and Platform Engineering survey, so they are one datapoint, not two. Honeycomb’s “Wide Events vs. Three Pillars: AI Observability Costs” contains no cost figures at all despite its title, and its adaptive tail-sampling processor is “working toward alpha” upstream — not merged into OpenTelemetry and not GA; today it ships only in Honeycomb’s own Collector distribution. Red Hat AI 3.5 is a genuinely interesting multi-tenancy release with no performance numbers of any kind. And the two O’Reilly nonhuman-identity essays are a two-part series by the same authors published two days apart, not two independent reads on the problem. Read accordingly — the arguments are often good, but an argument is not a measurement.
On our watch list
- Whether Honeycomb’s adaptive tail-sampling processor actually lands upstream. It is described as “working toward alpha” in the OpenTelemetry Collector and currently ships only in Honeycomb’s own distribution, derived from Refinery. Watch the contrib repository rather than the blog: an upstream merge would make dynamic, rate-targeting tail sampling a vendor-neutral capability, and until then it is a reason to pick a distribution.
- Whether Red Hat ships storage offloading out of developer preview. Everything else in AI 3.5’s multi-tenancy story — fair-share scheduling, admission control, tenant isolation, CPU offloading, per-user token metering — is generally available. Storage offloading for GPU memory is not, and it is the piece that decides whether you can oversubscribe accelerators without a latency cliff.
- Whether OpenAI’s March 2028 automated-researcher target survives its own supervision bottleneck. The same dataset that shows 3.1 agent-workdays per human workday also shows humans intervening on more than half of successful long-running tasks. Watch whether the next publication reports intervention rate falling, because throughput that scales while review capacity does not is the constraint that target has to clear.
- Whether anyone publishes agent-observability cost data that is not vendor-supplied. Every cost figure attached to AI observability this week came from a company selling the remedy. A single engineering organisation publishing its own $/GB, span volume and retention numbers for an agent workload would be worth more than the rest of this category combined.
- Whether AWS’s prefix-routing numbers reproduce outside AWS’s benchmark harness. The long-context result is large and the short-context result is nearly nil, which is exactly the shape you would expect — and exactly why an independent run on a different model and traffic mix matters. Watch for anyone publishing their own before/after KV cache hit rate after switching the routing strategy.
- Whether per-tenant metric isolation becomes a platform default. Adobe’s
MetricAccess CRD is still v1alpha1 despite production use, and the pattern — RBAC-scoped, label-enforced, self-service metric reads — is the thing most multi-tenant GPU platforms are missing. Watch whether it graduates, and whether Prometheus operators absorb the idea rather than leaving it to a proxy.
- Whether the two nonhuman-identity ratios ever converge. Rubrik Zero Labs says 45:1, CyberArk says 82:1, and the gap is nearly 2x on the single number most agent-governance budgets are being sized against. Watch for a methodology disclosure from either side, because without one the ratio is a talking point rather than an input.
- Whether Conductor’s v4 architecture reaches anyone outside Netflix. The public OSS repository has been unmaintained since December 2023 and the 420-million-executions work lives in an internal fork. The design lessons are transferable; the code is not. Watch whether Netflix re-opens the fork or whether Temporal and the surviving forks absorb the pattern instead.
- Whether value-level data assertions show up in mainstream pipeline tooling. Job-status monitoring caught none of the failures described this week. Watch for schema registries and output-range assertions becoming default scaffolding in Airflow and Spark templates rather than something each team rebuilds after its own 11-day incident.
- Whether detection-as-code vendors publish latency and volume figures. Mars Security’s intel-to-rule automation has no availability date, no pricing and no published latency; the only quantity disclosed is that generated rules are backtested against 30 days of customer data. Watch for a number attached to “real time” before treating it as a pipeline component.
- Whether OpenTelemetry’s generative-AI semantic conventions stabilise fast enough to matter. Session-scoped agent tracing is converging on client, server and MCP spans, but the conventions are still moving. Watch for the first agent framework that emits them by default rather than behind a flag — that is when cross-vendor agent traces stop being a porting exercise.
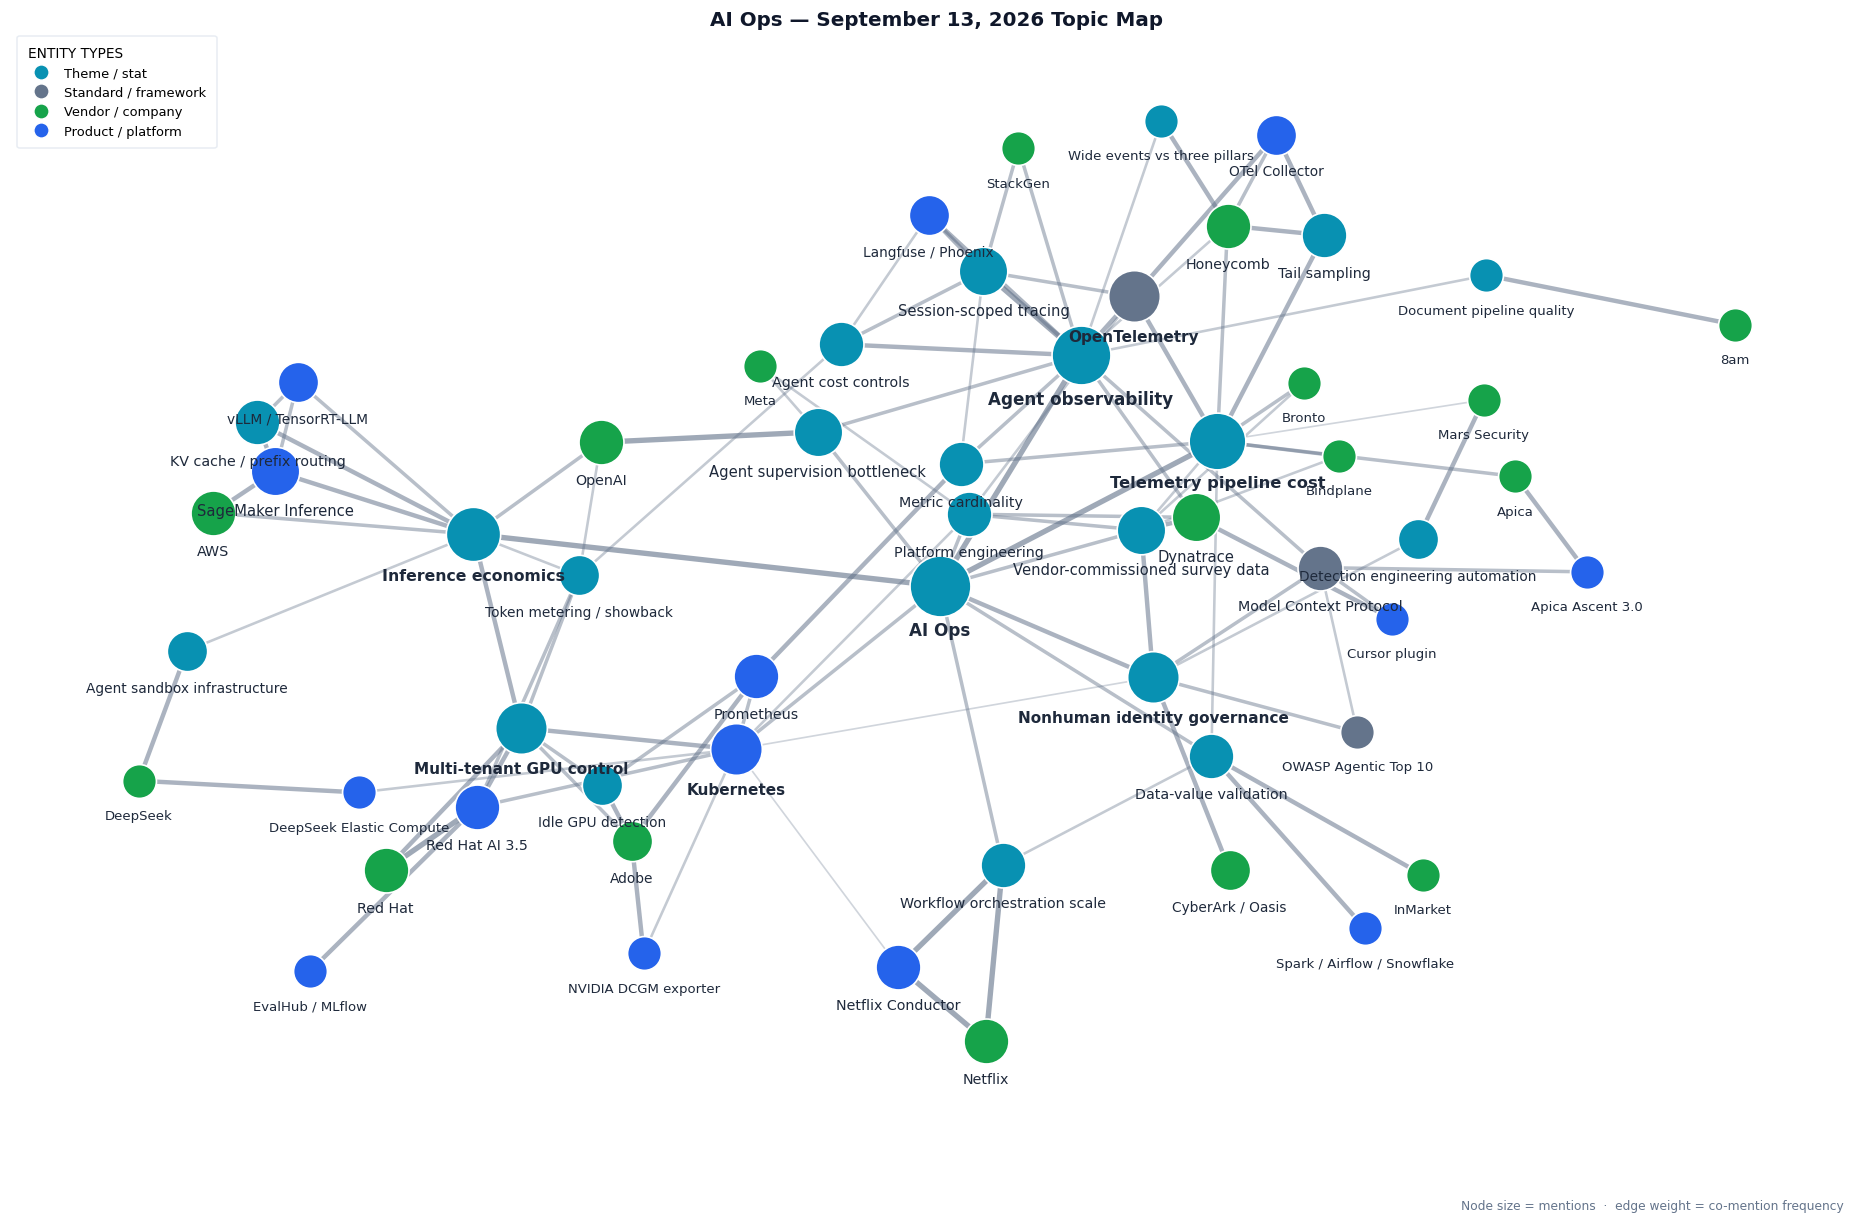
This week’s topic map — inference economics anchors the left, wiring KV-cache prefix routing, vLLM and SageMaker to AWS, and multi-tenant GPU control to Red Hat AI 3.5, Adobe’s DCGM-and-Prometheus stack, idle-GPU detection and token showback. Agent observability sits upper-centre through session-scoped tracing, agent cost controls, metric cardinality, Langfuse and StackGen; telemetry pipeline cost runs to the right through tail sampling, the OpenTelemetry Collector, Honeycomb, Bindplane, Bronto and Apica. Nonhuman identity governance anchors the lower right with the OWASP Agentic Top 10, MCP and Mars Security; Netflix Conductor and data-value validation form the reliability cluster below; and a vendor-commissioned-survey node ties Dynatrace, Bronto, Bindplane and the identity research together, because that is where most of this week’s percentages actually come from.
View interactive topic map →
Article index
21 articles, grouped by sub-theme. Fifteen are from this week’s coverage window (September 7–13); six are longer-form foundational reads on the beat. Sponsorships and author affiliations are named in each group.
Inference and GPU infrastructure economics
Where the accelerator money goes when several tenants share the same fleet — a routing strategy that turns shared prompt prefixes into cache hits, per-tenant GPU metrics that make idle capacity visible, a multi-tenancy release with no benchmark attached, and a hiring signal about agent sandbox capacity. AWS’s figures are its own internal benchmarks; Red Hat’s release carries no performance numbers at all.
Agent observability and trace debugging
Why request-scoped APM does not explain an agent failure, and what a session-scoped trace carries instead. Note the affiliations: the InfoQ piece reports on a CNCF post by a StackGen engineer; “It passed CI” is a Dynatrace-sponsored post written by a Dynatrace employee and its trace timings are an illustrative example; the Cursor plugin is a Dynatrace product announcement; and the document-observability column is by the CTO of the vendor 8am and contains no numbers at all.
Telemetry pipelines, sampling and storage cost
The group with the highest claim-to-evidence ratio in the issue. “Observability has a data problem” is sponsored by Bronto and its retention and search figures are Bronto product claims; “The SIEM Isn’t the Problem” is a contributed column by Bindplane’s CEO and co-founder; the Honeycomb sampling processor is not merged upstream and not GA; and the Honeycomb wide-events post has no cost figures despite its title. Apica’s market numbers are Futurum forecasts, not product results.
Reliability at scale: workflows and data correctness
The two best-evidenced engineering stories of the week, and the only ones where the numbers came out of a production system rather than a survey: an orchestration engine rebuilt around what it loads into memory, and a pipeline that passed every check it had while producing wrong answers.
Security ops and nonhuman identity governance
Agent credentials as an operations problem rather than a security-team problem. The two O’Reilly essays are a two-part series by the same two authors, published two days apart — read them as one argument, not two independent sources — and nearly every statistic in them is drawn from an identity-vendor survey. The Mars Security item is a vendor announcement carried under a staff byline, with no availability date, pricing or latency figure.
Platform teams, agent org design and the supervision bottleneck
What happens to an engineering organisation when agent throughput outruns human review. OpenAI’s figures are its own published data; Meta’s claims are self-reported and largely unquantified with no named engineer; and every percentage in the Dynatrace platform-engineering post comes from Dynatrace’s own commissioned 2026 State of SRE and Platform Engineering report — the same survey behind the sponsored post in the agent-observability group above.
Detailed write-ups
1. Prefix-aware routing on SageMaker: a large win on long shared prefixes, and almost none on short ones
AWS Machine Learning Blog · September 10, 2026
Amazon SageMaker Inference gained a third routing strategy, PREFIX_AWARE, alongside the existing RANDOM and LEAST_OUTSTANDING_REQUESTS, and it is generally available rather than preview. The idea is simple enough to adopt in an afternoon: instead of spreading requests evenly, the endpoint routes requests that share a prompt prefix to the instance that already holds that prefix in its KV cache. The post is written by Kareem Syed-Mohammed, a principal product manager at AWS, with five AWS colleagues — a vendor engineering blog, and every number in it is AWS’s own internal benchmark run on AWS infrastructure with no third-party verification. Say that out loud before you put it in a capacity plan.
With that caveat in place, the shape of the result is more useful than the headline. On a one-hour long-context benchmark using 8,000-token shared prefixes, P50 time-to-first-token fell 71–77%, P90 TTFT fell 33–37%, KV cache hit rate rose from roughly 25% to 82%, and throughput improved 15–16%. On a thirty-minute short-context run the same configuration produced P50 TTFT down only 13–16%, P90 down 24–37%, a hit rate of roughly 30% to 80% — and throughput up 1.7–2.0%. That second set is the number to reason from. The benefit is concentrated almost entirely in workloads with long shared prefixes: large system prompts, RAG preambles, few-shot blocks, agent scaffolding reused across every call. If your prompts are short and mostly unique, prefix-aware routing is close to a no-op, and AWS’s own data says so.
The operational detail is where the post earns its place. Routing overhead is 1.3–1.9 ms per request against model TTFTs of 63–280 ms across the tests — small enough to ignore, but worth knowing before you argue about it. Two tunables decide behaviour: PrefixLength, settable from 1,024 to 65,536 tokens (AWS’s example uses 4,096), which controls how much of the prompt is considered for affinity; and ConcurrencyThreshold, from 1 to 1,024, above which the router abandons affinity and falls back to load-based routing. That fallback is the safety valve that stops cache affinity turning into a hot-instance problem, and it is the setting most likely to need tuning against your real traffic shape. The benchmark configuration is published — seven ml.p5.48xlarge instances serving Llama 3.1 70B Instruct on vLLM with prefix caching enabled — and the strategy works with both vLLM and TensorRT-LLM containers, across InvokeEndpoint, InvokeEndpointWithResponseStream and the OpenAI-compatible Chat Completion API. The prerequisite nobody should skip: prefix caching has to be enabled in the serving engine for any of this to do anything. AWS’s own summary line — “In our benchmarks on Llama 3.1 70B, this reduced P50 TTFT by up to 77 percent” — is accurate and vendor-self-reported, and the phrase “up to” is doing the work.
Sources: AWS Machine Learning Blog (reduce LLM latency with prefix-aware routing on Amazon SageMaker Inference) — https://aws.amazon.com/blogs/machine-learning/reduce-llm-latency-with-prefix-aware-routing-on-amazon-sagemaker-inference/
2. Netflix rebuilt Conductor around what it loads into memory — and the code is not coming back
InfoQ · September 11, 2026
The most instructive architecture story of the week is a diagnosis, not a product. Netflix’s Conductor now runs 420 million workflow executions per month across 200,000 workflow definitions used by 150 applications spanning Content and Studio Engineering, Ads and Games — and the ceiling it broke through was a single design decision. Aravind Ramkumar, a Conductor maintainer at Netflix, states it plainly: “The engine loaded the entire running workflow into memory for evaluation.” Every evaluation of a running workflow paid for the whole workflow, so the cost of a decision grew with the size of the thing being decided about. Version 4 separates workflow metadata from task and user data and splits pending from terminal task state, which is why the maximum supported workflow size grew roughly 10x, from about 2,500 tasks to 30,000.
The reported gains are p99 latency down 40% and a lock-contention result that is the most transferable number here: failed lock-acquisition attempts fell from about 2,700 per interval to essentially zero once workflow evaluation moved to asynchronous processing on exclusive queues. If you run any orchestrator where multiple workers contend for the right to advance the same workflow, that is the pattern worth copying — not a bigger lock, but a design where only one consumer is ever eligible. The datastore changes underneath are equally legible: execution data migrated from Dynomite to Apache Cassandra; large task inputs and outputs moved out of the database to Amazon S3; DynoQueues replaced by Timestone; Apache Kafka added to decouple indexing from execution so that an indexing backlog can no longer stall execution; and Elasticsearch plus Apache Iceberg for near-term indexing and long-term storage respectively. Reported by InfoQ’s Leela Kumili; the figures originate with Netflix.
One thing to be clear about before anyone plans a migration: none of this is open source. Netflix stopped maintaining the public Conductor repository in December 2023 and moved to an internal fork, and these improvements live there. What you can take is the architecture — do not load the whole workflow to make one decision, move large payloads to object storage, decouple indexing from the execution path, and give each workflow a single eligible evaluator. What you cannot take is the implementation.
Sources: InfoQ (Netflix reworks Conductor for 420 million monthly workflow executions) — https://www.infoq.com/news/2026/09/netflix-conductor-4-workflow/
3. A GPU idle for eleven days, and the cardinality trick that made it visible
CNCF Blog · September 9, 2026
The best practitioner post of the week comes from two Adobe engineers — Bingi Narasimha Karthik, a senior cloud engineer, and Ramkumar Nagaraj, a senior computer scientist — writing as CNCF Kubestronaut contributors, and it starts from an observation most platform teams will recognise: the platform scrapes GPU metrics centrally, tenants cannot query their own, and so nobody who could act on a wasted GPU can see it. Their example is one GPU idle at 0% utilisation for eleven straight days. Their framing line is the right one: “You can’t fix what you’re not allowed to see.”
The engineering answer is a per-tenant read path built from parts you already run — Prometheus centrally and per tenant, the NVIDIA DCGM exporter, kube-rbac-proxy, prom-label-proxy, Nginx, and the Kubernetes API for service discovery and RBAC — governed by a custom resource, MetricAccess in API group observability.ethos.io/v1alpha1. Note the v1alpha1: this is in production use at Adobe and still carries an alpha API version. The headline number is a cardinality result rather than a cost result, and it is the one to carry into your own cluster: with metricIsolation: false a tenant view produced more than 10,000 time series; with metricIsolation: true it produced about 300, a ~97% reduction. That is what makes the rest affordable — GPU utilisation sampled every second and retained for months, which is what an idle-detection query actually needs, against a default collection interval of 30 seconds that is configurable per MetricAccess object. The three detection rules are worth writing down verbatim: under 5% GPU utilisation sustained for an hour means idle or oversized allocation; over 70% utilisation with fewer than one request per five minutes means stuck or leaking; more than ten requests per five minutes with under 5% GPU utilisation means CPU-bound serving with the accelerator wasted. The proxy is open source under Apache 2.0 at github.com/adobe/prometheus-multi-tenant-proxy and was demoed at KubeCon + CloudNativeCon India 2025.
It is worth reading this against the rest of the week’s telemetry-cost coverage, because it is the only item in that cluster with a measured number attached. Honeycomb’s Mike Goldsmith describes an adaptive tail-sampling processor for the OpenTelemetry Collector, and the status needs stating precisely: it is “working toward alpha” upstream — not merged into OpenTelemetry and not generally available. Today it ships only in Honeycomb’s own Collector distribution, derived from Honeycomb’s Refinery, and the figures in the post — a 2-second decision delay, a 30-second trace timeout, 15-second rate recalculation, a 10% sampling goal, 1,000 spans per second — are default configuration values and worked examples, not benchmark results. Honeycomb’s companion post, “Wide Events vs. Three Pillars: AI Observability Costs” by Nick Travaglini, is mis-titled: despite “Costs” in the headline it contains no cost figures at all — no dollars per gigabyte, no event sizes, no cardinality counts, no percentage savings — and its e-commerce chatbot scenario is explicitly illustrative. It is a good conceptual argument for one wide event per unit of work over three disconnected signals; it is not a cost analysis. “Observability has a data problem. AI is about to make it worse.” is a Bronto-sponsored post on The New Stack, written by freelance writer Will Kelly; its figures — 100x more data retained, twelve months of full-fidelity retention, sub-second search across petabytes — are Bronto product claims, and its “observability costs reach 20–30% of infrastructure spend” is vendor framing; the piece also discloses that The New Stack’s owner, Insight Partners, is an investor in ClickHouse, a named partner. “The SIEM Isn’t the Problem. Your Telemetry Architecture Is” is a contributed column by Mike Kelly, CEO and co-founder of Bindplane, carried by APMdigest with no sponsorship disclosure; its “40%+ reduction in total telemetry volume” is a Bindplane claim for Bindplane’s own category, and its AI-incident figures (1.7% of unplanned incidents attributed to AI providers in 2023 against 10.7% year-to-date in 2026; 86% of IT leaders confident in AI governance against 30% with written policies) are cited with no named source at all. And Apica’s Ascent 3.0, launched 8 September with the Venn AI agent and an MCP server, offers one product metric — a vendor-claimed “10x faster” flow-only mode, unbenchmarked. The large market numbers in that write-up (14% DevOps tools spending growth in 2027, 72% planning increased investment, $226B by 2030 against $111.1B in 2025) are Futurum Group forecasts, not Apica results; do not attach them to the product. Adobe’s 97% is the only figure in this paragraph that anyone measured.
Sources: CNCF (whose GPUs are these, anyway?) — https://www.cncf.io/blog/2026/09/09/whose-gpus-are-these-anyway-secure-self-service-metrics-for-multi-tenant-kubernetes/ · Honeycomb (bringing the most advanced sampling to the OpenTelemetry Collector) — https://www.honeycomb.io/blog/bringing-most-advanced-sampling-opentelemetry-collector · Honeycomb (wide events vs. three pillars) — https://www.honeycomb.io/blog/wide-events-vs-three-pillars-ai-observability-costs · The New Stack (observability has a data problem) — https://thenewstack.io/opentelemetry-observability-telemetry-storage/ · APMdigest (the SIEM isn’t the problem) — https://www.apmdigest.com/siem-isnt-problem-your-telemetry-architecture · DevOps.com (Apica adds AI agents and MCP server) — https://devops.com/apica-adds-ai-agents-and-mcp-server-to-platform-for-managing-telemetry-data/
4. Red Hat AI 3.5 makes the GPU queue a first-class control — and publishes no numbers for it
The New Stack · September 10, 2026
Announced on 10 September, Red Hat AI 3.5 is about who gets the accelerator rather than which model runs on it, and for platform teams that is the more pressing question. Reported by technology journalist Adrian Bridgwater for The New Stack with no sponsorship disclosure; the product claims are Red Hat’s. Generally available in this release: fair-share GPU scheduling across tenants, priority-aware admission control and request routing, tenant isolation, CPU offloading for GPU memory management, observability dashboards, per-user token consumption tracking framed as showback, agent templates and starter kits, and EvalHub pre-deployment safety benchmarking. Developer preview only: storage offloading for GPU memory management. That split matters — storage offloading is the piece that would let you oversubscribe most aggressively, and it is the one you cannot yet run in production.
The design argument is sound and worth stating in your own capacity terms: priority-aware serving lets low-priority batch work consume spare capacity instead of requiring separately provisioned GPUs, while admission control protects the real-time inference path from being crowded out by it. Per-user token metering turns “the AI platform” into a cost line each team can see. EvalHub is open source and on GitHub; MLflow provides visual agentic tracing; the whole thing sits on Red Hat’s OpenShift AI and Kubernetes foundation. The piece also carries dissent, which is unusual enough to note: a Nutanix vice president argues that virtualization is the better isolation primitive for this problem. What the release does not contain is a single performance number — no utilisation gain, no latency figure, no throughput result, no cost comparison. Tushar Katarki, senior director of product for Red Hat AI, offers the framing instead: “With Red Hat AI 3.5, we are delivering the operational guardrails, verifiable trust, and multi-tenant controls needed to run AI as a mission-critical service rather than an unpredictable experiment.” Treat that as a statement of intent and plan a proof-of-concept with your own measurements, because there are none on offer.
The same multi-tenancy pressure shows up from an unexpected direction: DeepSeek is hiring 150 backend engineers, none of whom will work on models. The roles are for DeepSeek Elastic Compute (DSec), sandbox infrastructure targeting hundreds of thousands of concurrent agent sandboxes on a single cluster, built on 3FS, Firecracker, QEMU and Docker; harness team lead Cui Tianyi joined in March 2026, and DeepSeek said in June 2026 it planned at least to double headcount. The headline framing is rhetorical but the substance holds: a frontier lab is spending its hiring budget on isolation, scheduling and sandbox lifecycle rather than on modelling. That is the same problem Red Hat is selling a product for, and it is a reasonable signal about where agent-platform work actually sits.
Sources: The New Stack (Red Hat AI 3.5 tackles the GPU queue) — https://thenewstack.io/red-hat-ai-multitenancy/ · The New Stack (DeepSeek is hiring 150 engineers) — https://thenewstack.io/deepseek-dsec-agent-hiring/
5. 3.1 agent-workdays per human workday, and a review queue that did not grow
The New Stack · September 7, 2026
The most quotable number of the week comes from OpenAI’s own publication, “Research Acceleration: View Inside OpenAI” (August 2026), covering January to August 2026, and reported by Amanda Caswell for The New Stack. As of mid-August, OpenAI’s research organisation logged 3.1 agent-workdays per human workday. Inference cost per researcher ran to a median of $600 a day and a 90th percentile of $7,000 — roughly a 12x spread across people doing nominally the same job, which on its own is an argument for per-user metering before it is an argument about models. The finding with the most operational weight is this: humans had to intervene on more than 50% of successful long-running tasks in the four-to-eight-hour band. Not failed tasks — successful ones. The cost of agent work is not concentrated in failures you can alert on; it is spread across successes that needed a person anyway.
One caveat on the headline. The article’s framing — that agents are “creating more work, not less” — is the author’s interpretation, not an OpenAI claim. What the data supports is narrower and more useful: agent throughput scaled, human review capacity did not, and supervision became the binding constraint. OpenAI’s own line is the more careful one: “More agent hours don’t automatically mean more useful research.” A second figure shows how workloads move rather than shrink under governance: after usage restrictions, GPU allocation to the Astra model fell 59.2% while allocation to other models rose 17.2%, absorbing roughly 85% of the Astra drop rather than reducing total spend. If you throttle one model without a capacity policy behind it, you have moved the bill, not cut it. OpenAI’s stated goal remains an automated AI researcher by March 2028 — a target that has to clear the very bottleneck this dataset documents.
Two organisational reads sit alongside it, and both need their provenance stated. Meta’s recipe for agents as “organizational second brains”, reported by InfoQ’s Sergio De Simone, describes a four-layer design that is genuinely worth borrowing: a knowledge system, a reasoning layer of composable recipes, an evaluation framework, and a self-improvement loop that requires no model retraining. The substance is in that structure, because the results are self-reported by Meta, largely unquantified, and attributed to no named engineer — assessments dropping “from days to minutes”, results “useful almost all the time”, “zero regressions across improvement cycles”. The only hard number in the piece is 200+ structured files in the knowledge layer. Separately, Dynatrace’s platform-engineering post by Klint Finley, a principal content editor at Dynatrace, reports that 89% of organisations have an internal developer platform, 74% provide dashboards, 53% expected toil reduction against 45% who observed it, 53% expected MTTD/MTTR gains against 46% who observed them, and 52% monitor AI tools. Every one of those percentages comes from Dynatrace’s own commissioned State of SRE and Platform Engineering 2026 report — the same survey that supplies the statistics in the Dynatrace-sponsored New Stack post discussed below. They are one source, not two, and the expectation-versus-observation gap is the only part worth carrying: platform teams are consistently getting less toil relief than they budgeted for.
Sources: The New Stack (AI agents are creating more work, not less) — https://thenewstack.io/openai-agent-research-bottleneck/ · InfoQ (Meta’s recipe for building agents as organizational second brains) — https://www.infoq.com/news/2026/09/meta-organizational-agents/ · Dynatrace (how to tackle platform engineering’s biggest challenges in 2026) — https://www.dynatrace.com/news/blog/how-to-tackle-platform-engineerings-biggest-challenges-in-2026/
6. Eleven days green, forty per cent wrong: the monitoring gap under every RAG and feature pipeline
VentureBeat · September 8, 2026
This is a contributed column — Siddharth Arun is a senior member of technical staff at Salesforce, and the incidents he describes happened at a prior employer, InMarket (formerly NinthDecimal), not at Salesforce — and it is the most directly actionable piece in the issue. The first incident: a pipeline ran green for eleven days while producing audience counts that were about 40% wrong. Every job-level check passed, because every job-level check was asking whether the job ran, and none was asking whether the output was right. The second, at the same organisation: three days of audience data vanished without an alert firing. The scale gives the failure teeth — over a petabyte of location and advertising event data, billions of events per day, on Spark ETL, Airflow DAGs, Snowflake and AWS S3 with MapR legacy and an Iceberg lakehouse pattern. His sentence is the one to circulate internally: “The system ran successfully while producing incorrect results.”
The prescribed fix is not more job-status monitoring; it is value-level assertions and schema validation registries inside the pipeline — expected ranges, row-count deltas against history, distribution checks, null-rate bounds, referential expectations — evaluated on the data the job emits rather than on the job’s exit code. For AI-operations teams, the relevance is direct: the same pattern of green-but-wrong sits underneath every retrieval corpus and every feature table feeding a model, and a silently degraded embedding index produces confidently wrong answers rather than an outage. One number in the column is not the author’s: the “68% of data teams report a mean time-to-detect of four or more hours for data incidents” figure is sourced to a Monte Carlo 2023 vendor survey, and should be read as such.
The same argument arrives in a weaker form from Jeff Sidell, CTO of 8am, an OCR and document-pipeline vendor, writing in APMdigest with no disclosure on the page. His case is that document ingestion — extraction fidelity, layout handling, OCR error rates — is an unmonitored stage feeding AI pipelines, and that the observability stack watches the model and ignores the documents going into it. That is a reasonable argument and a fair gap to name. It is worth stating plainly that the article contains no numbers at all: no error rates, no volumes, no accuracy deltas, no customer figures. Use it as a prompt to instrument your document-ingestion stage; do not use it as evidence for anything.
Sources: VentureBeat (most pipeline monitoring checks if the job ran) — https://venturebeat.com/orchestration/most-pipeline-monitoring-checks-if-the-job-ran-this-one-didnt-check-if-the-numbers-were-right · APMdigest (your AI pipeline may have a document observability problem) — https://www.apmdigest.com/your-ai-pipeline-may-have-document-observability-problem
7. Session-scoped traces: the span model that explains why an agent looped
InfoQ · The New Stack · Dynatrace · September 8–13, 2026
InfoQ’s Mark Silvester reports on a CNCF member post by Sabith K Soopy, a principal engineer at StackGen, and the core claim is one most teams discover the hard way: conventional APM tells you whether services responded, not why an agent looped, called an invalid endpoint, or silently skipped work. Agent failure is a session-scoped phenomenon, and a request-scoped trace cannot represent it. His summary: “The hardest part isn’t building them; it’s understanding what they’re doing when they go wrong.” Note up front that the article contains no measured numbers — no latencies, no costs, no volumes. It is a design pattern, and a good one.
The pattern: every LLM call, tool execution and sub-agent delegation becomes its own span carrying execution latency and token cost, with nested child spans preserving the delegation chain, assembled through Langfuse into a session trace. The export design deliberately trades completeness for availability — an asynchronous batch exporter queues spans in memory and flushes periodically, so a telemetry outage drops data rather than blocking the agent. Cost controls are enforced before execution rather than after: hard iteration caps, per-tool call limits, and pre-execution blocking of identical consecutive tool requests, with session cost compared against a rolling average to flag model-routing errors and tool-hallucination loops. The cardinality warning is stated explicitly and is the one most teams will violate first: dynamic session IDs must never be used as Prometheus metric labels — only bounded operational metrics get exported, and the session detail lives in traces. The post-incident record is an append-only searchable log of tool calls, governance decisions and memory operations with credentials and PII redacted. The surrounding tool landscape is named usefully: Langfuse for nested session traces, LangSmith for turning anomalous traces into test datasets, Arize Phoenix as an OpenTelemetry-native option with LLM-as-a-judge evaluation, and the OpenTelemetry generative-AI semantic conventions covering client, server and MCP spans.
Two adjacent items make the same argument with declared commercial interests, and both need labelling. “It passed CI. It passed your evals. The customer still got the wrong answer.” is a Dynatrace-sponsored post on The New Stack, written by Sean O’Dell, who works at Dynatrace. Its statistics — 77% of platform-engineering teams embedding observability in some services and 40% fully integrated, n=919 — come from Dynatrace’s own commissioned 2026 State of SRE report, the same survey behind the Dynatrace platform-engineering blog in this issue; they corroborate each other only in the sense that a number corroborates itself. Its trace timings — a 12.4-second total run, an 8.1-second generation call, 2.6 seconds across three identical searches — are an illustrative worked example, not measured production data. Read for the argument that passing CI and passing evals says nothing about what a specific customer session did; ignore the numbers. Separately, Dynatrace’s own blog, by Philipp Hamann and Christoph Enzinger, announces a Cursor plugin, generally available in the Cursor Marketplace, connecting the IDE to production telemetry through an MCP server bundling 30 Dynatrace skills. That 30 is the only figure in the post — no time-savings claim, no MTTR figure, no version number. Worth noting that this is the third Dynatrace-origin item in a single issue; the pattern of pulling production context into the editor is real and several vendors are shipping it, but one vendor should not carry three slots of framing unchallenged.
Sources: InfoQ (session traces and cost controls help diagnose AI agent failures) — https://www.infoq.com/news/2026/09/observability-ai-agents/ · The New Stack (it passed CI, it passed your evals) — https://thenewstack.io/ai-agent-trace-debugging/ · Dynatrace (investigate production issues from Cursor with the Dynatrace plugin) — https://www.dynatrace.com/news/blog/investigate-production-issues-from-cursor-with-the-dynatrace-plugin/
8. Nonhuman identity: an ownership problem wearing a credentials problem’s clothes
O’Reilly Radar · Help Net Security · August 25 – September 8, 2026
Tushar Badlani and Mohit Bansal wrote a two-part series on O’Reilly Radar — Shadow Agents on 25 August and The Identity Crisis No One Planned For on 27 August — and it should be read as one argument by two authors, not as two independent confirmations. The analysis is independent and every statistic is attributed to a named third party, but most of those third parties are identity-security vendors, which is the standing caveat on this entire category. The fault line is visible in the first number: the nonhuman-to-human identity ratio is cited as 45:1 by Rubrik Zero Labs and 82:1 by CyberArk’s 2025 Identity Security Landscape — two sources disagreeing by nearly 2x on the single figure most agent-governance budgets are sized against.
The readiness numbers are consistent even where the ratios are not. 92% lack confidence that legacy IAM tooling can govern AI agents and 78% have no AI identity policy (Oasis Security with the Cloud Security Alliance, January 2026, n=383). On credential hygiene, 47% of nonhuman identities have gone a year or more without rotation, and 62% of AWS identities inactive for 90 or more days still retain full access (both Entro). The ownership gap is the part that is genuinely an operations problem rather than a security one: 8% of identities have lost their HR owner, 51% of organizations have no clear owner for AI identities (One Identity/GigaOm; WEF 2025), and 66% of enterprises report an NHI-related compromise. The authors put the operational consequence better than a control framework would: “An identity with no owner can’t be reviewed on a schedule, rotated with confidence, or disabled without someone first proving a negative: that nothing still depends on it.” The 2026 attack evidence is concrete — poisoned Model Context Protocol tool descriptions (Microsoft, June 2026), a fake AI-agent skill that reached about 26,000 agents (The Hacker News, June 2026), and the WriteOut cross-tenant session-token exposure. Governance scaffolding exists in the OWASP Top 10 for Agentic Applications, released December 2025 with 100+ contributors, where categories ASI03 and ASI04 cover identity and privilege. The market sizing — $11.3B in 2025 to a projected $38.8B by 2036 at 12.2% CAGR (Meticulous Research) — is analyst forecasting and adds nothing operational.
The first instalment carries figures worth keeping separately. 1% have fully implemented just-in-time privileged access while 91% have at least half of privileged access always-on (CyberArk, January 2026, n=500 US practitioners); 45% of the workforce uses unapproved AI tools (Verizon 2026 DBIR); 75% of CISOs found unsanctioned AI tools in production (Saviynt 2026); 10 of 11 surveyed open source coding agents were found vulnerable (Adversa AI GuardFall); and Sysdig Threat Research recorded 31 seconds to lateral progression after an authentication failure and 1,342 Nacos configuration records encrypted in the JADEPUFFER operation. The direction both pieces argue for is intent-bound, short-lived authorization replacing long-lived tokens — while conceding that reliably discovering every shadow agent remains unsolved, which is the honest part.
On the tooling side of the same beat, Mars Security announced a system that turns threat-intelligence advisories into validated, deployable detection rules, backtested against 30 days of customer data before deployment, with integrations to CrowdStrike Falcon, Wiz, Splunk, Snowflake and Databricks. Read as detection-engineering automation rather than as a threat story, it belongs in the same conversation as every other intel-to-artefact pipeline: the value is in eliminating the manual translation step between an advisory and a rule that actually runs, and in the backtest that stops a new rule flooding the queue. Help Net Security carried it under an “Industry News” staff byline from the vendor announcement, and it comes with no availability date, no pricing, no latency figure and no detection-volume figure — the 30-day backtest window is the only quantity disclosed. “Real time” in the headline is currently a positioning claim.
Sources: O’Reilly Radar (the identity crisis no one planned for) — https://www.oreilly.com/radar/the-identity-crisis-no-one-planned-for-governing-non-human-agents-at-enterprise-scale/ · O’Reilly Radar (shadow agents, standing privileges, and the governance gap) — https://www.oreilly.com/radar/shadow-agents-standing-privileges-and-the-governance-gap-between-deployment-and-discovery/ · Help Net Security (Mars Security brings threat intelligence to detection in real time) — https://www.helpnetsecurity.com/2026/09/08/mars-security-real-time-intel-based-detection/
Calls to action
- Measure your shared-prefix length before enabling prefix-aware routing. AWS’s own benchmark gives 71–77% P50 TTFT reduction on 8,000-token shared prefixes and only 1.7–2.0% throughput gain on short contexts. Pull the actual prefix distribution from your prompt logs first; if your shared preamble is small, set
PrefixLength and ConcurrencyThreshold from that measurement or skip the change entirely.
- Turn on prefix caching in the serving engine before you touch routing. The SageMaker result depends on vLLM prefix caching being enabled; routing affinity to an instance whose cache is off buys nothing. Confirm the engine flag, then measure KV cache hit rate as your primary indicator rather than latency.
- Add value-level assertions to your top three pipelines this week. Eleven days green with 40% wrong counts, and three days of vanished data with no alert, both passed every job-status check. Assert expected ranges, row-count deltas against history and null-rate bounds on the output, and register schemas — especially on anything feeding a retrieval corpus or a feature table.
- Give tenants read access to their own GPU metrics, with label enforcement. Adobe’s pattern —
kube-rbac-proxy plus prom-label-proxy in front of per-tenant Prometheus — cut a tenant view from 10,000+ series to about 300. Ship the three idle-detection rules with it: under 5% for an hour, over 70% with under one request per five minutes, and over ten requests per five minutes with under 5% utilisation.
- Ban dynamic session IDs from your metric labels today. This is the cheapest fix in the issue and the one most agent deployments get wrong. Session detail belongs in traces; export only bounded operational metrics, and audit your existing agent instrumentation for unbounded label values before your Prometheus bill finds them for you.
- Enforce agent cost limits before execution, not after. Hard iteration caps, per-tool call limits and pre-execution blocking of identical consecutive tool calls stop a hallucination loop at the point it starts. Compare session cost against a rolling average to catch model-routing errors; a post-hoc dashboard only tells you what you already spent.
- Meter inference cost per user and publish the spread. OpenAI’s own data shows a 12x gap between the median researcher at $600/day and the 90th percentile at $7,000/day. You cannot manage a spread you have not measured, and per-user showback — the capability Red Hat just made generally available — is the mechanism that makes it visible without rationing anyone.
- Track human intervention rate on successful agent runs, not just failure rate. More than half of OpenAI’s successful four-to-eight-hour tasks needed a person. If your only agent metric is task success, your supervision load is invisible and your capacity plan is wrong by whatever that intervention rate turns out to be.
- Verify the upstream status of any sampling processor before you plan around it. Honeycomb’s adaptive tail sampler is “working toward alpha” and ships only in Honeycomb’s own Collector distribution. Check the OpenTelemetry contrib repository yourself for anything described as coming to the Collector, and treat published config defaults as defaults rather than as benchmark results.
- Find your unowned nonhuman identities and give each one a named human. 8% have lost their HR owner and 51% of organizations have no clear owner for AI identities. Start with the AWS case — identities inactive 90+ days that still hold full access — and rotate or disable rather than waiting for a discovery tool that can prove nothing depends on them.
- Ask every vendor for the survey methodology behind the percentage they quoted you. Three items in this issue rest on one Dynatrace-commissioned survey, two headline claims are product marketing inside sponsored posts, and the two identity ratios disagree by nearly 2x. Sample size, sponsor and question wording, or the number does not enter your business case.
|